library(ggplot2)
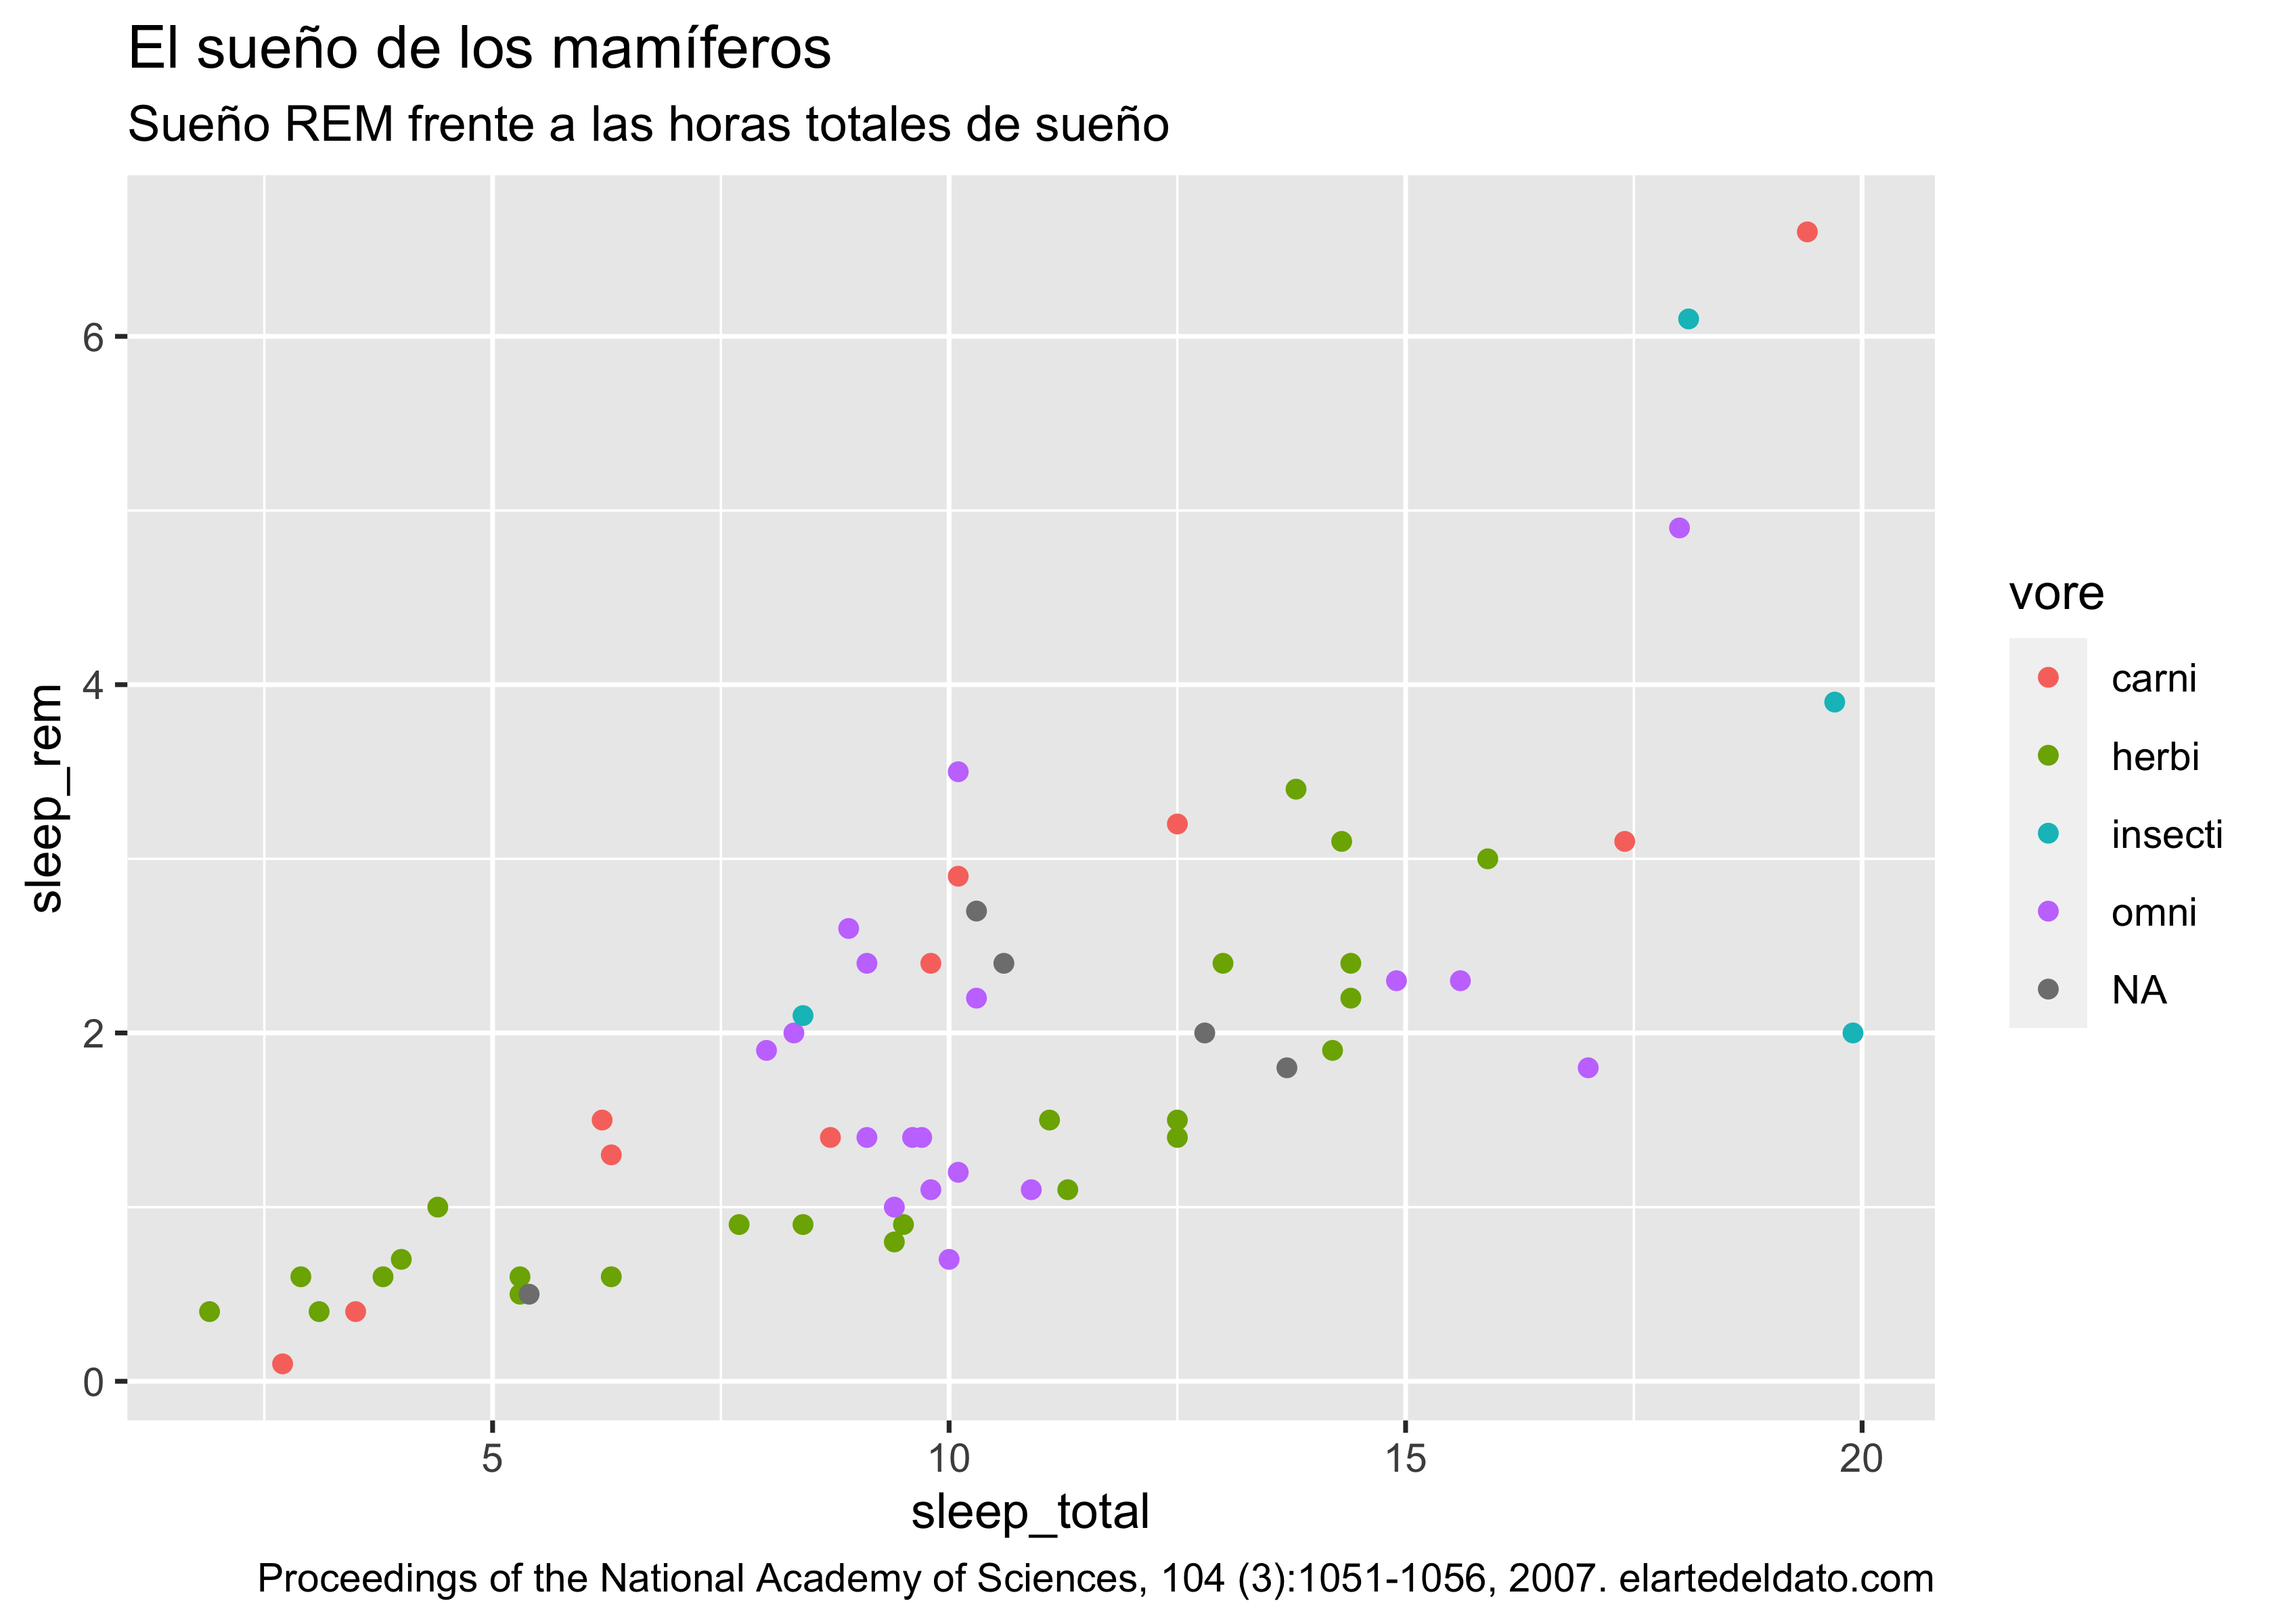
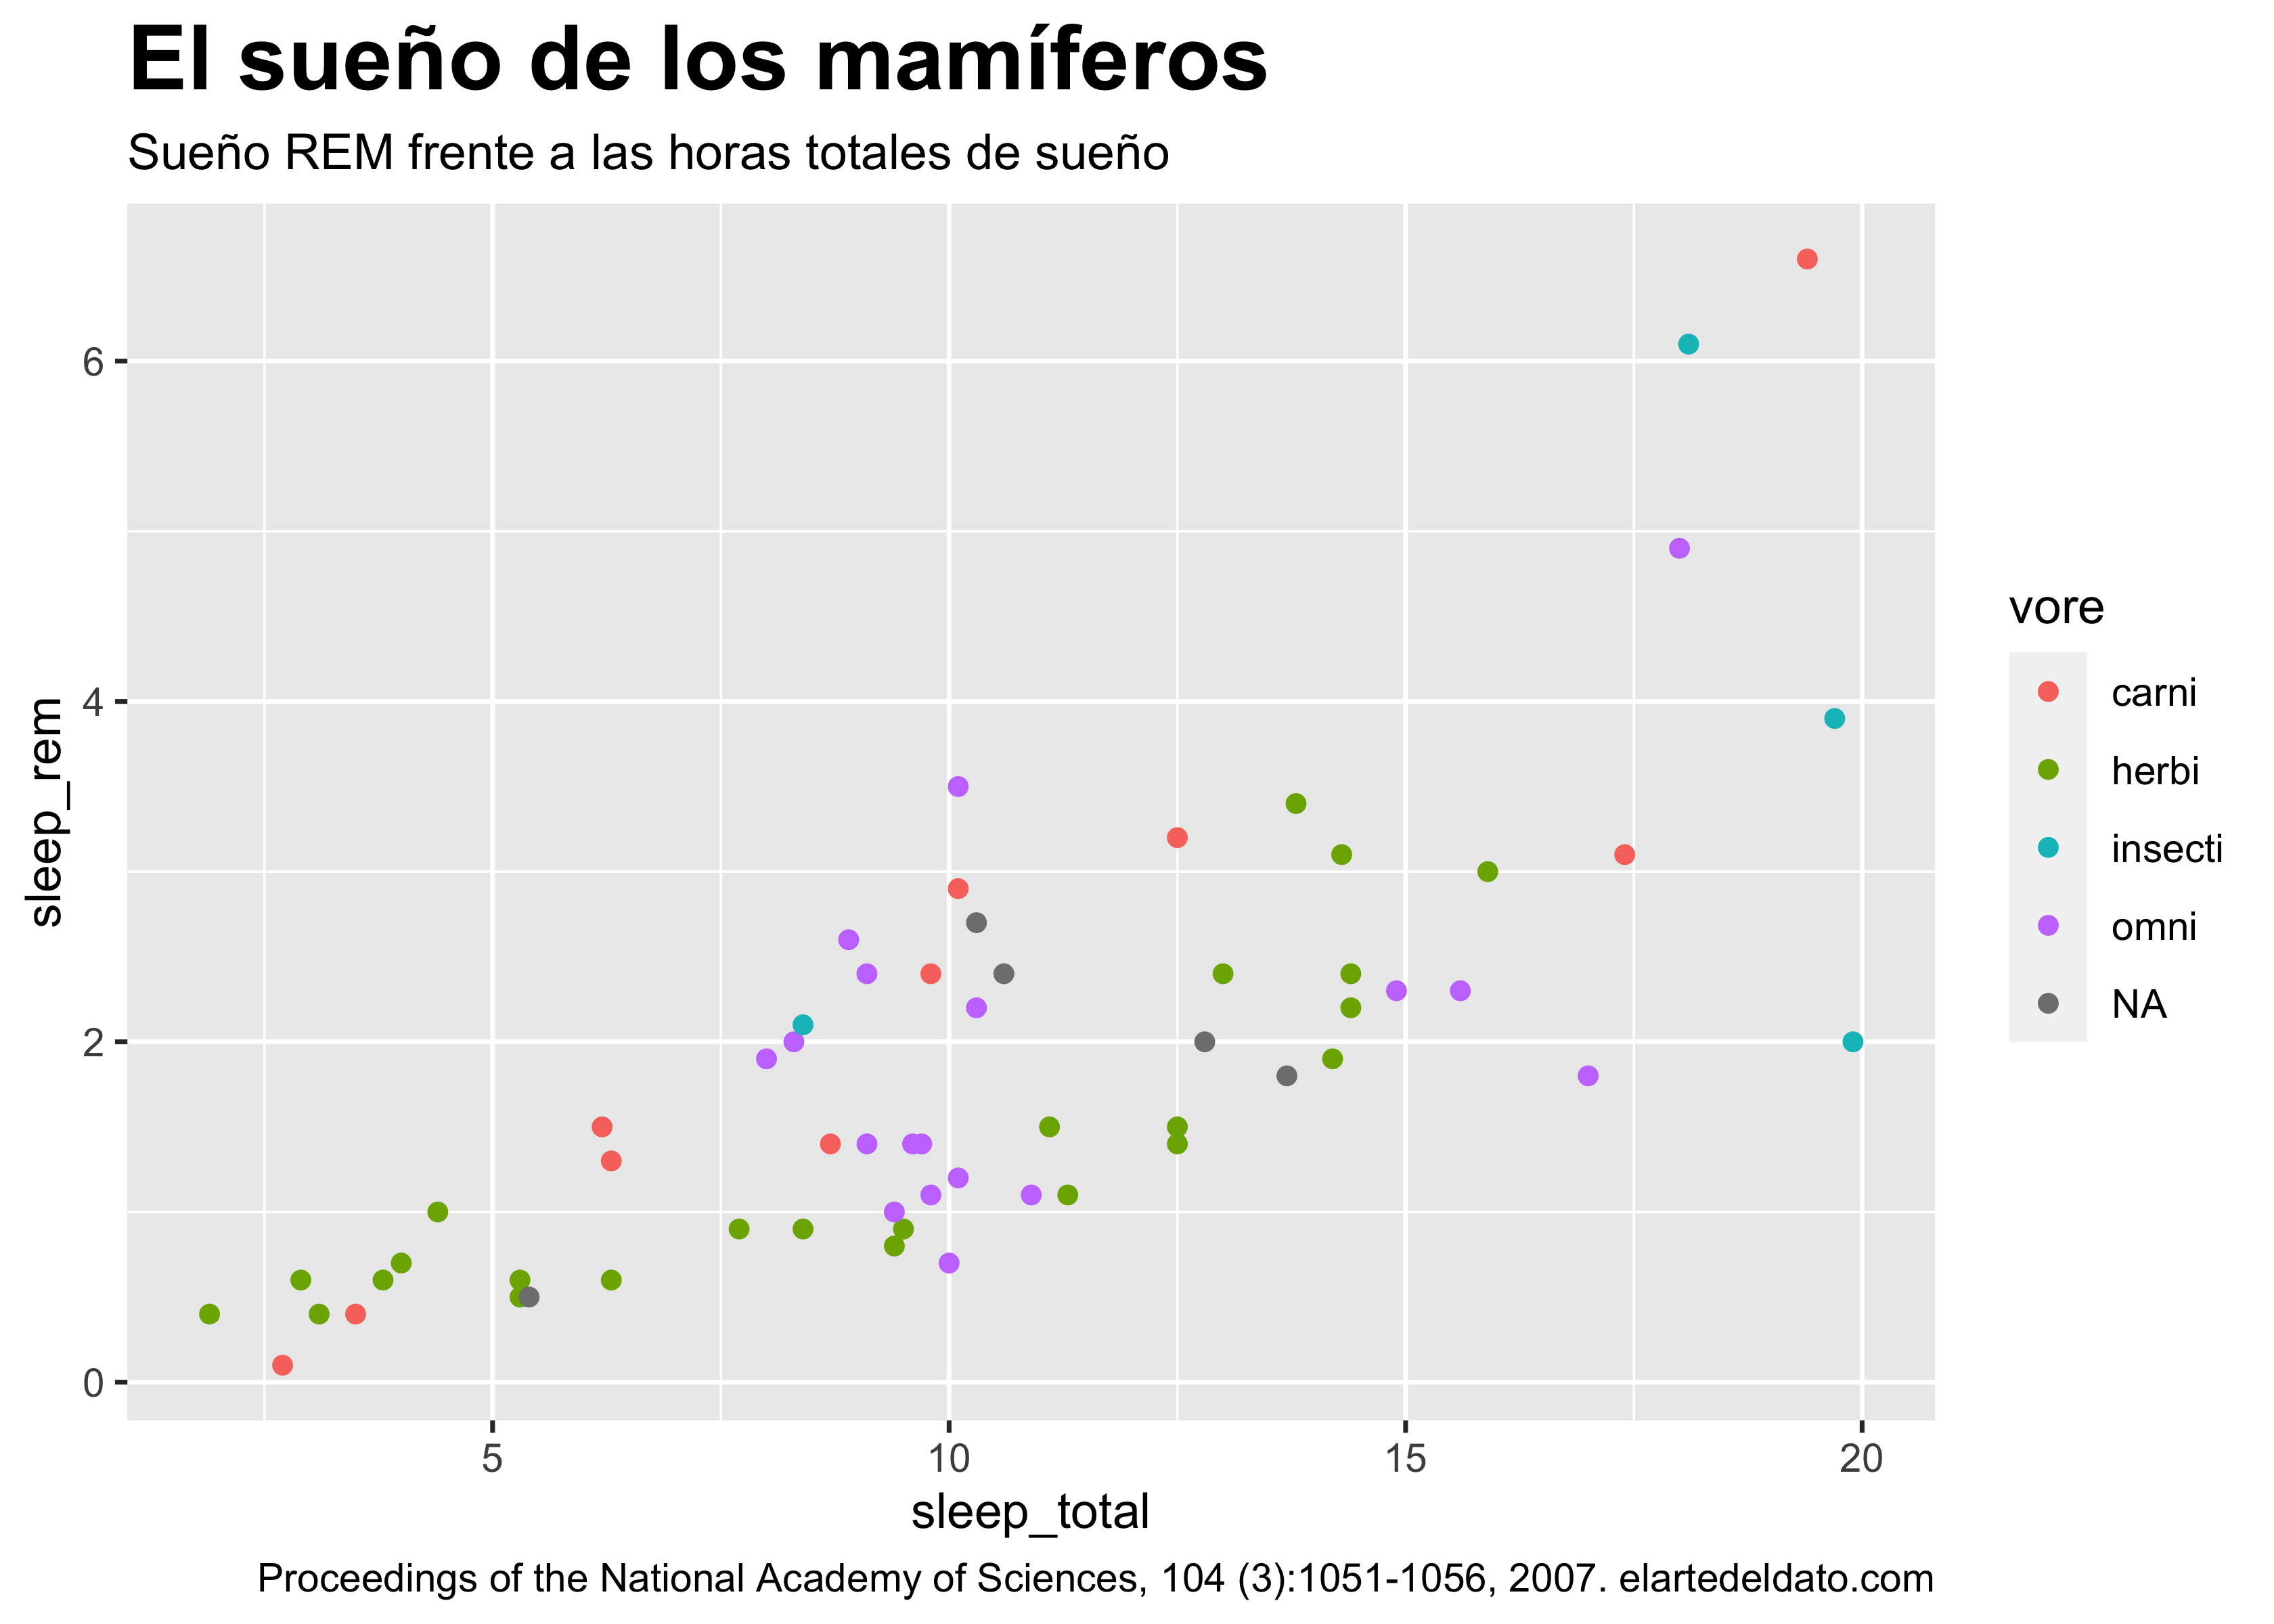
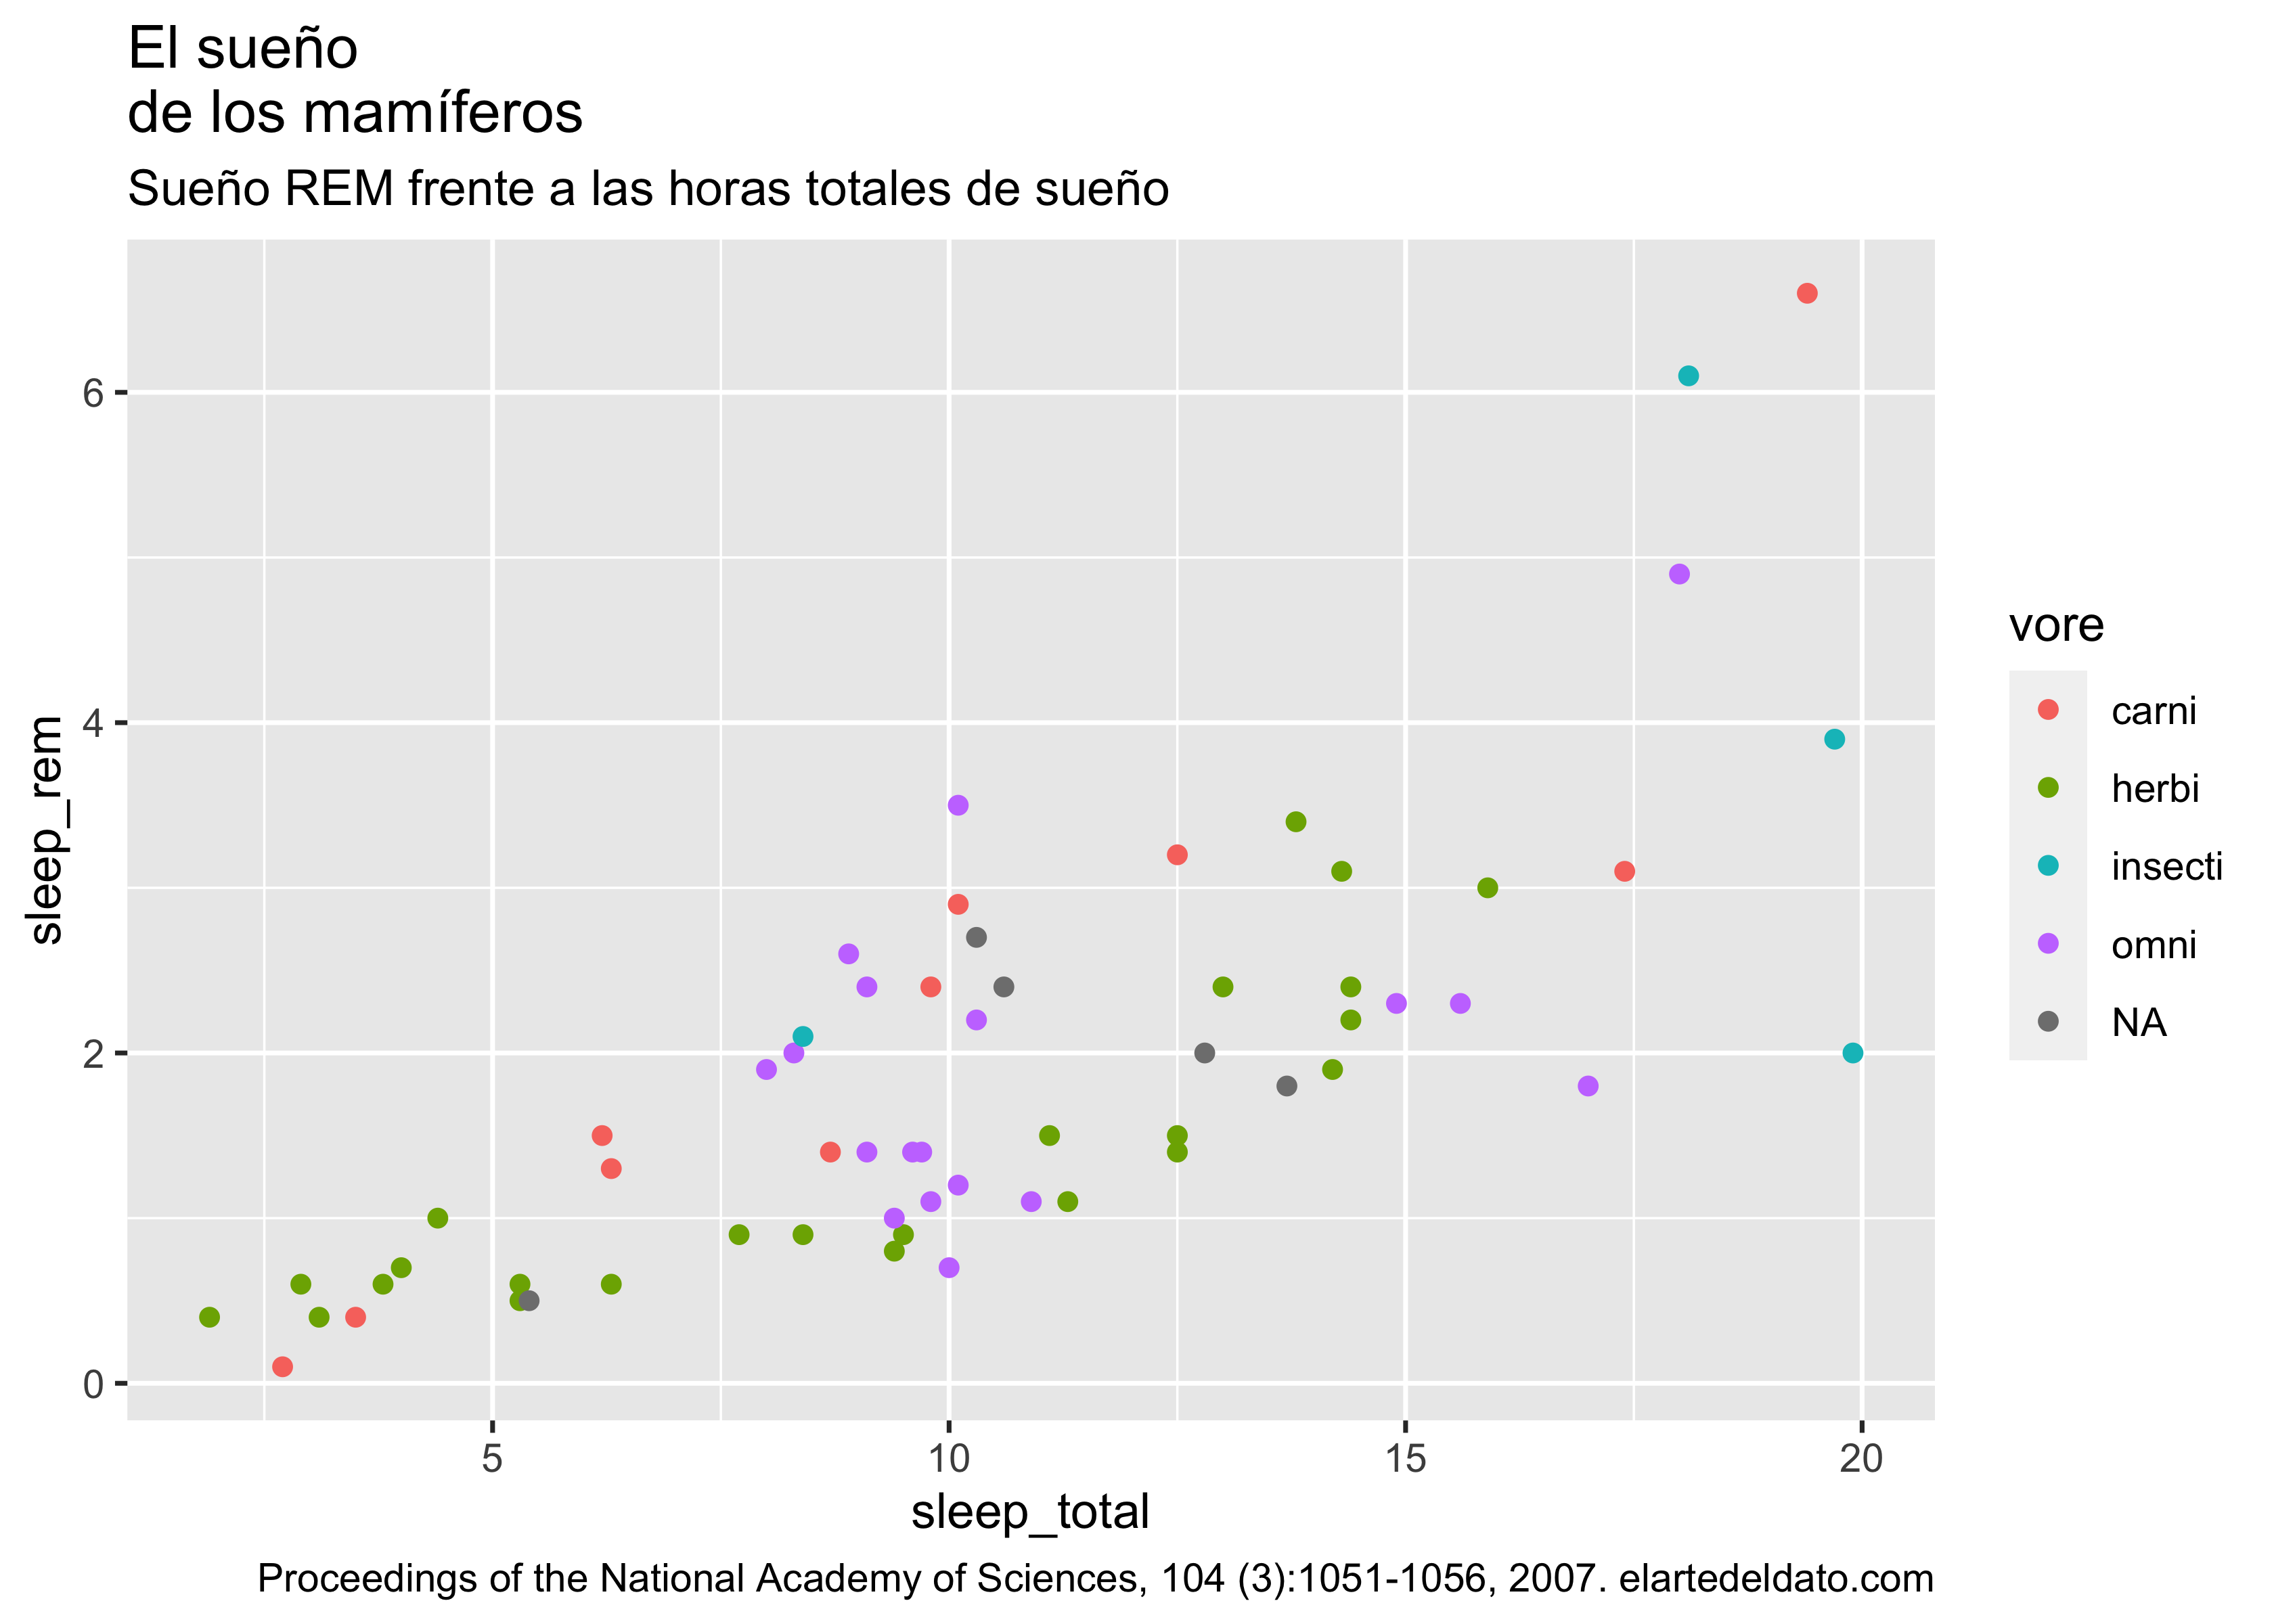
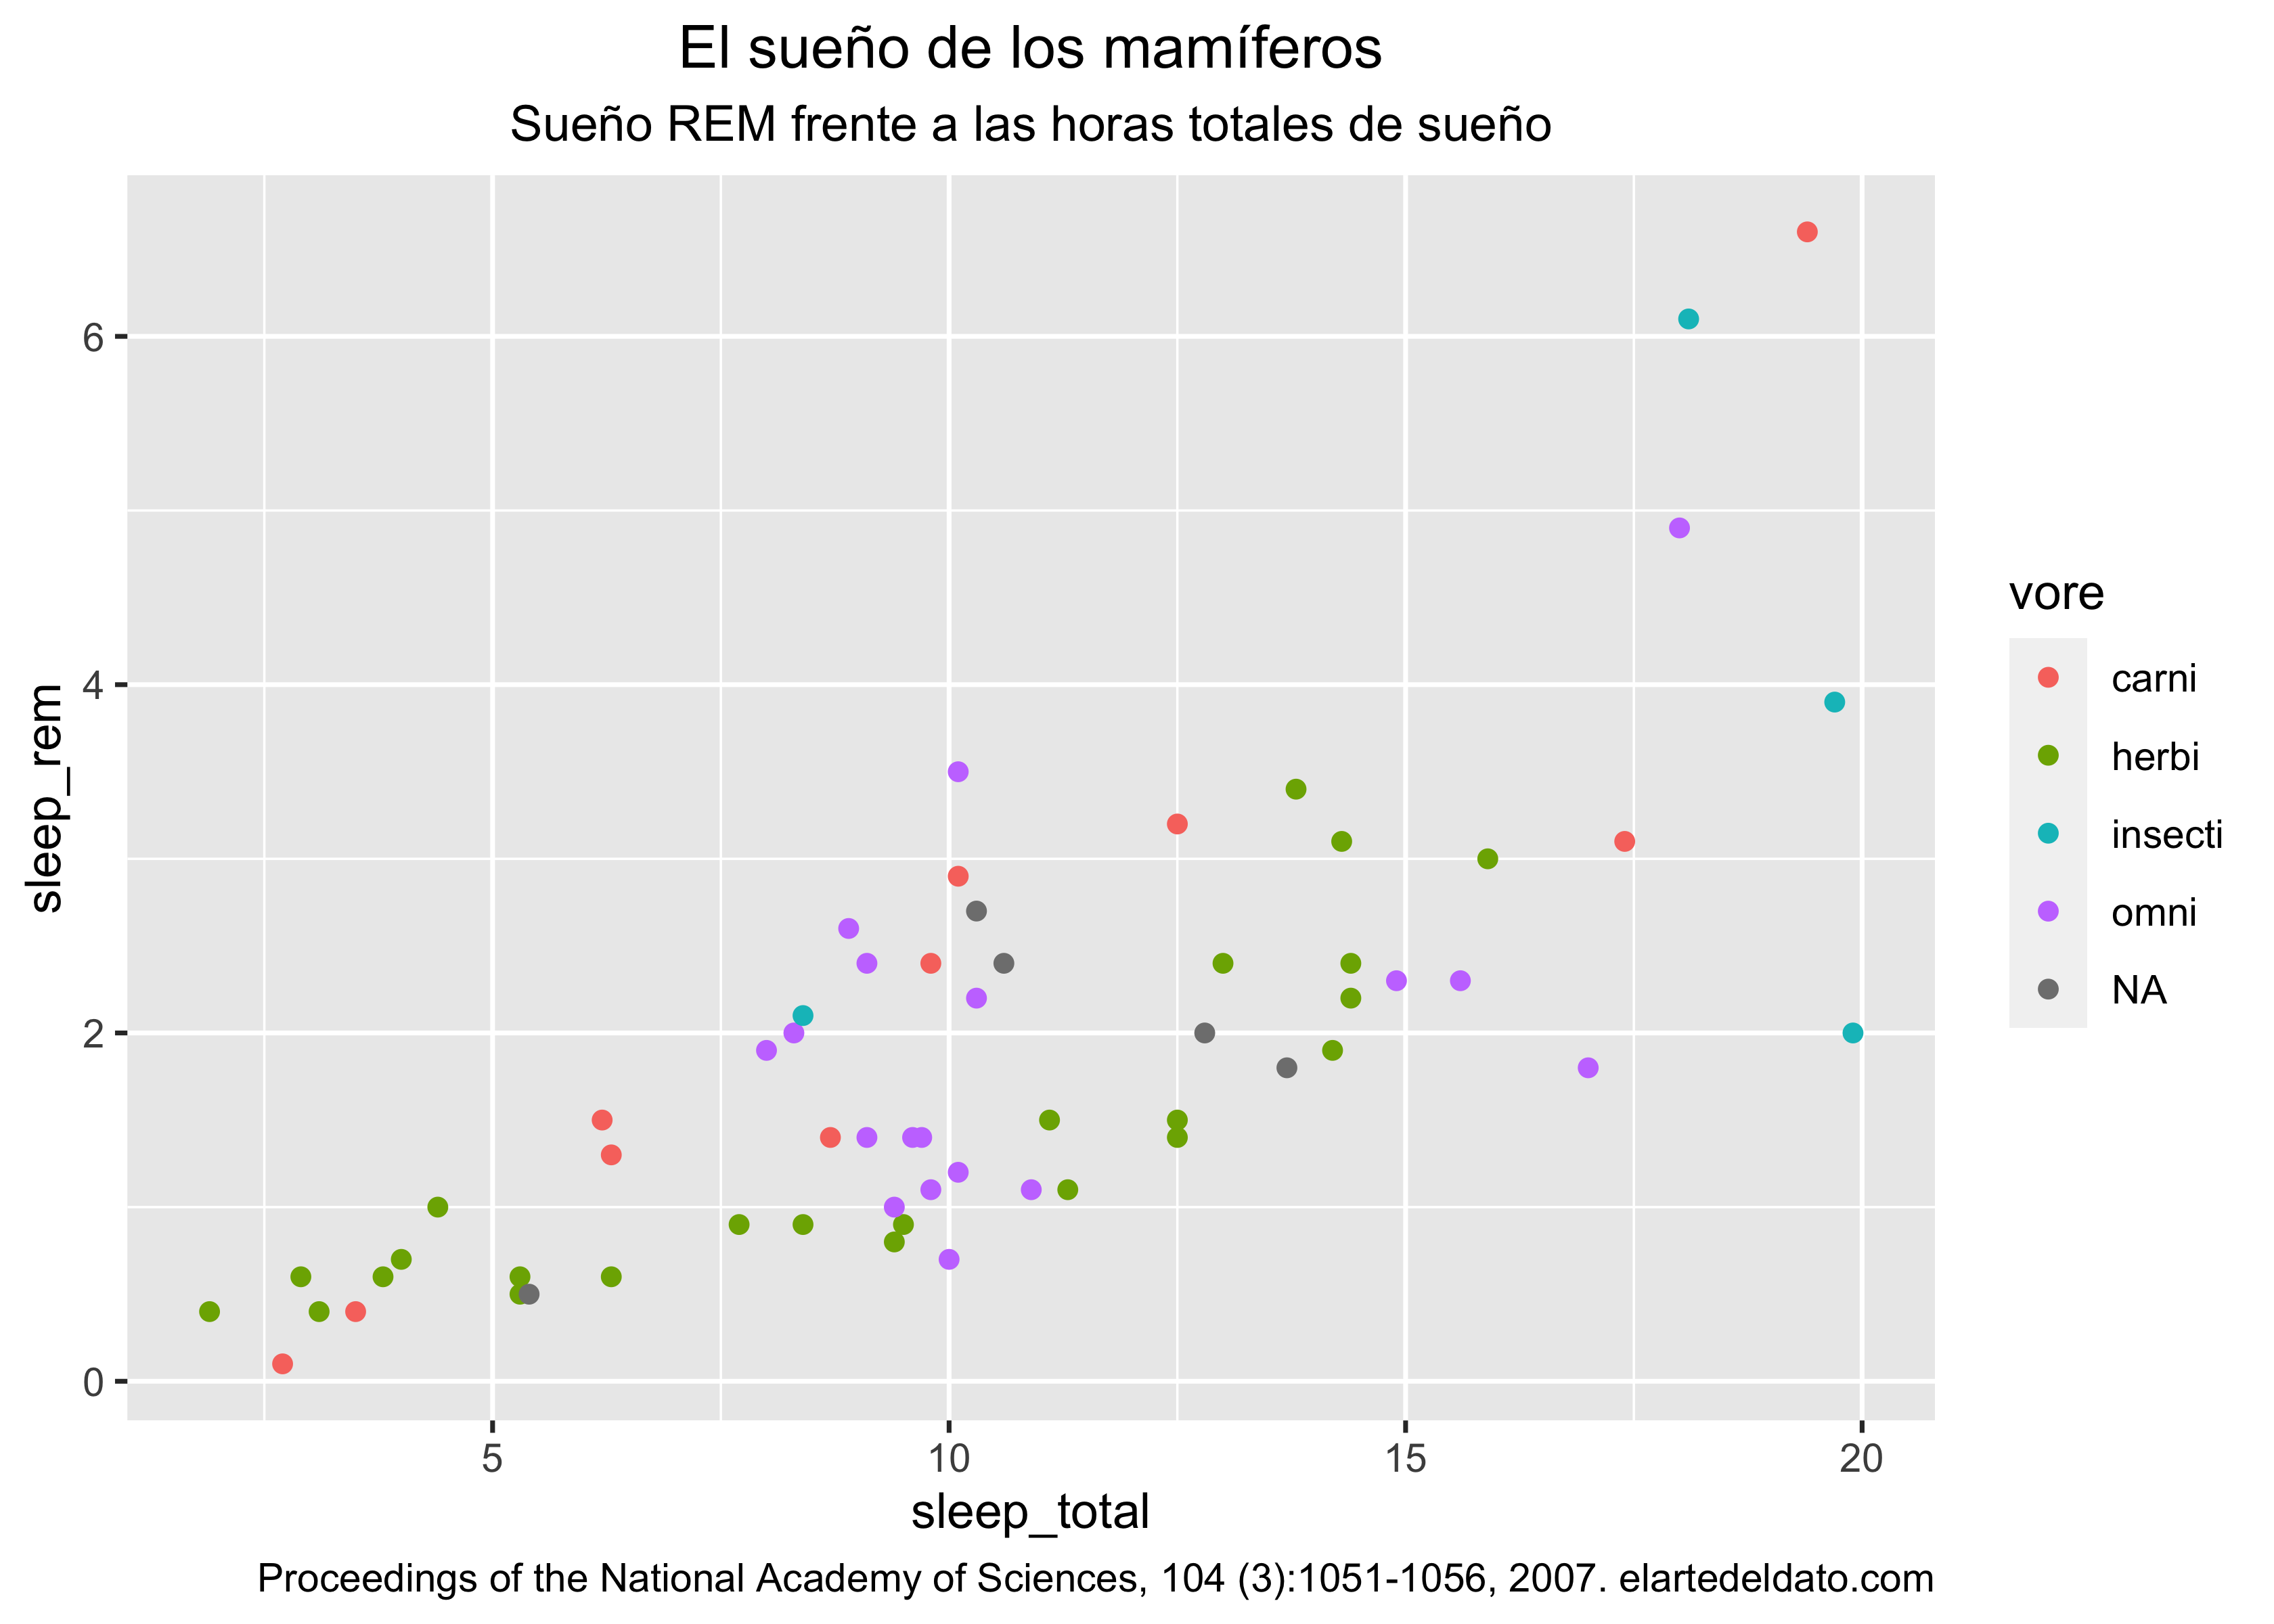
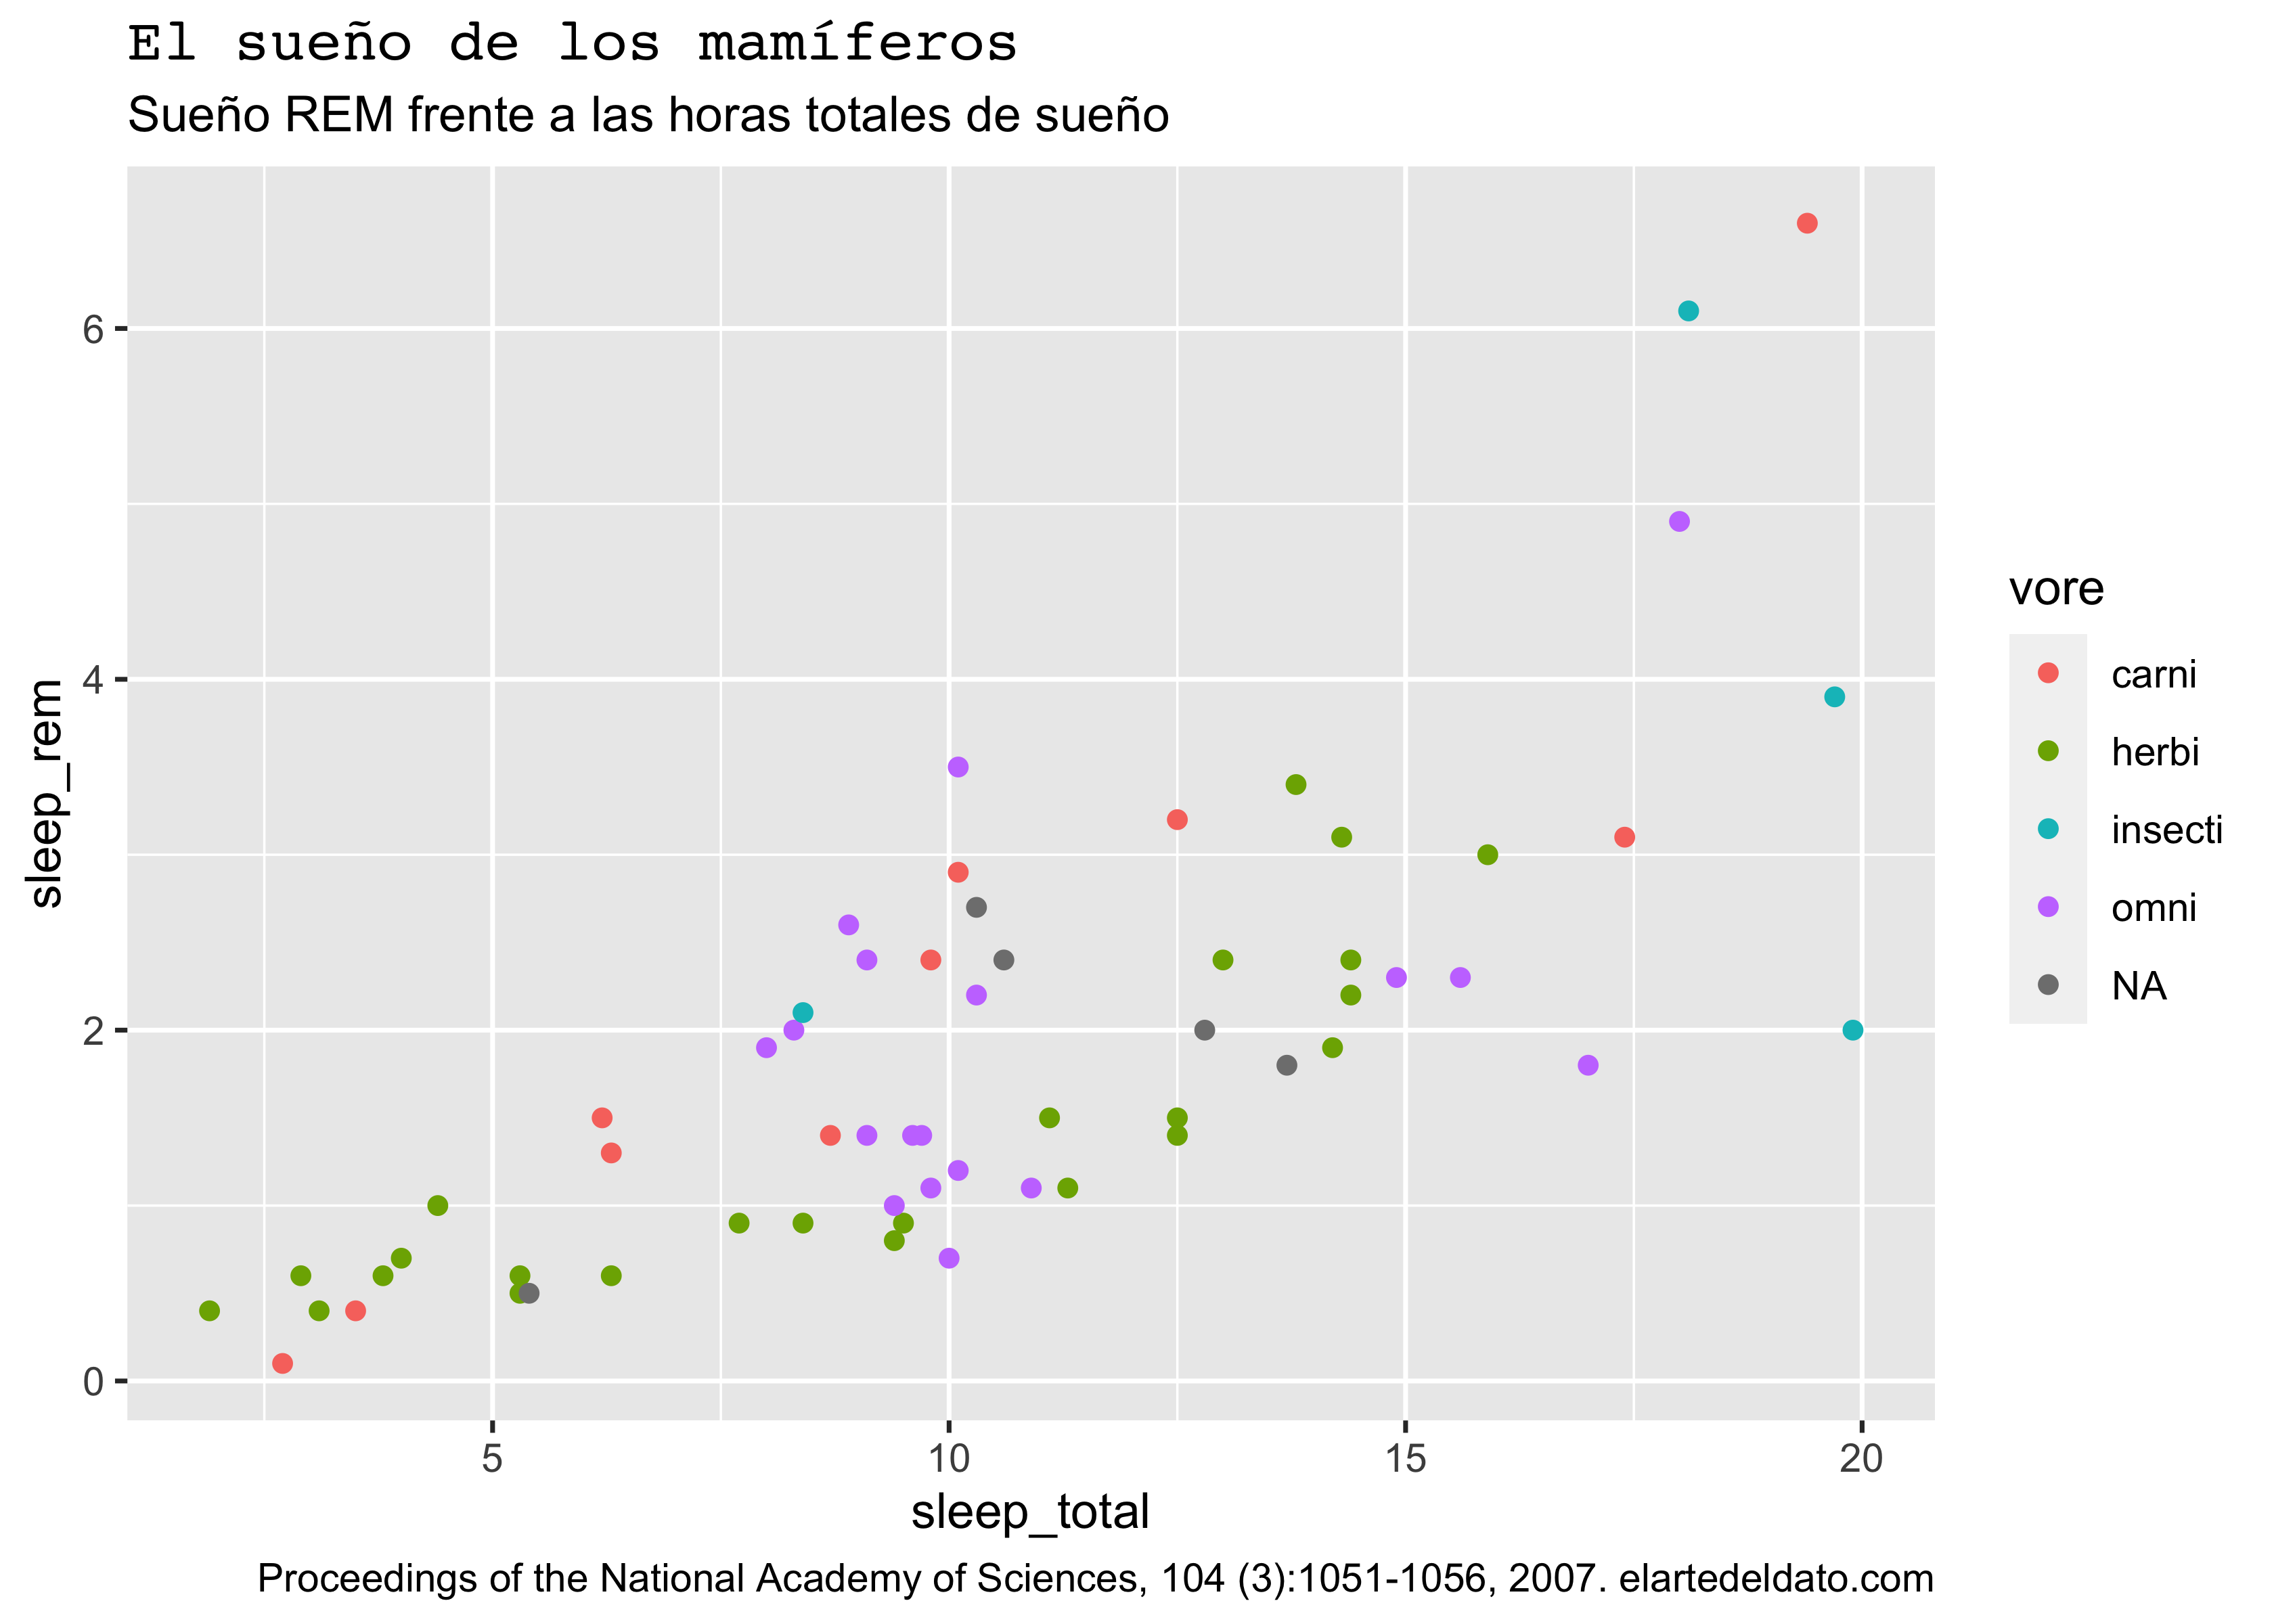
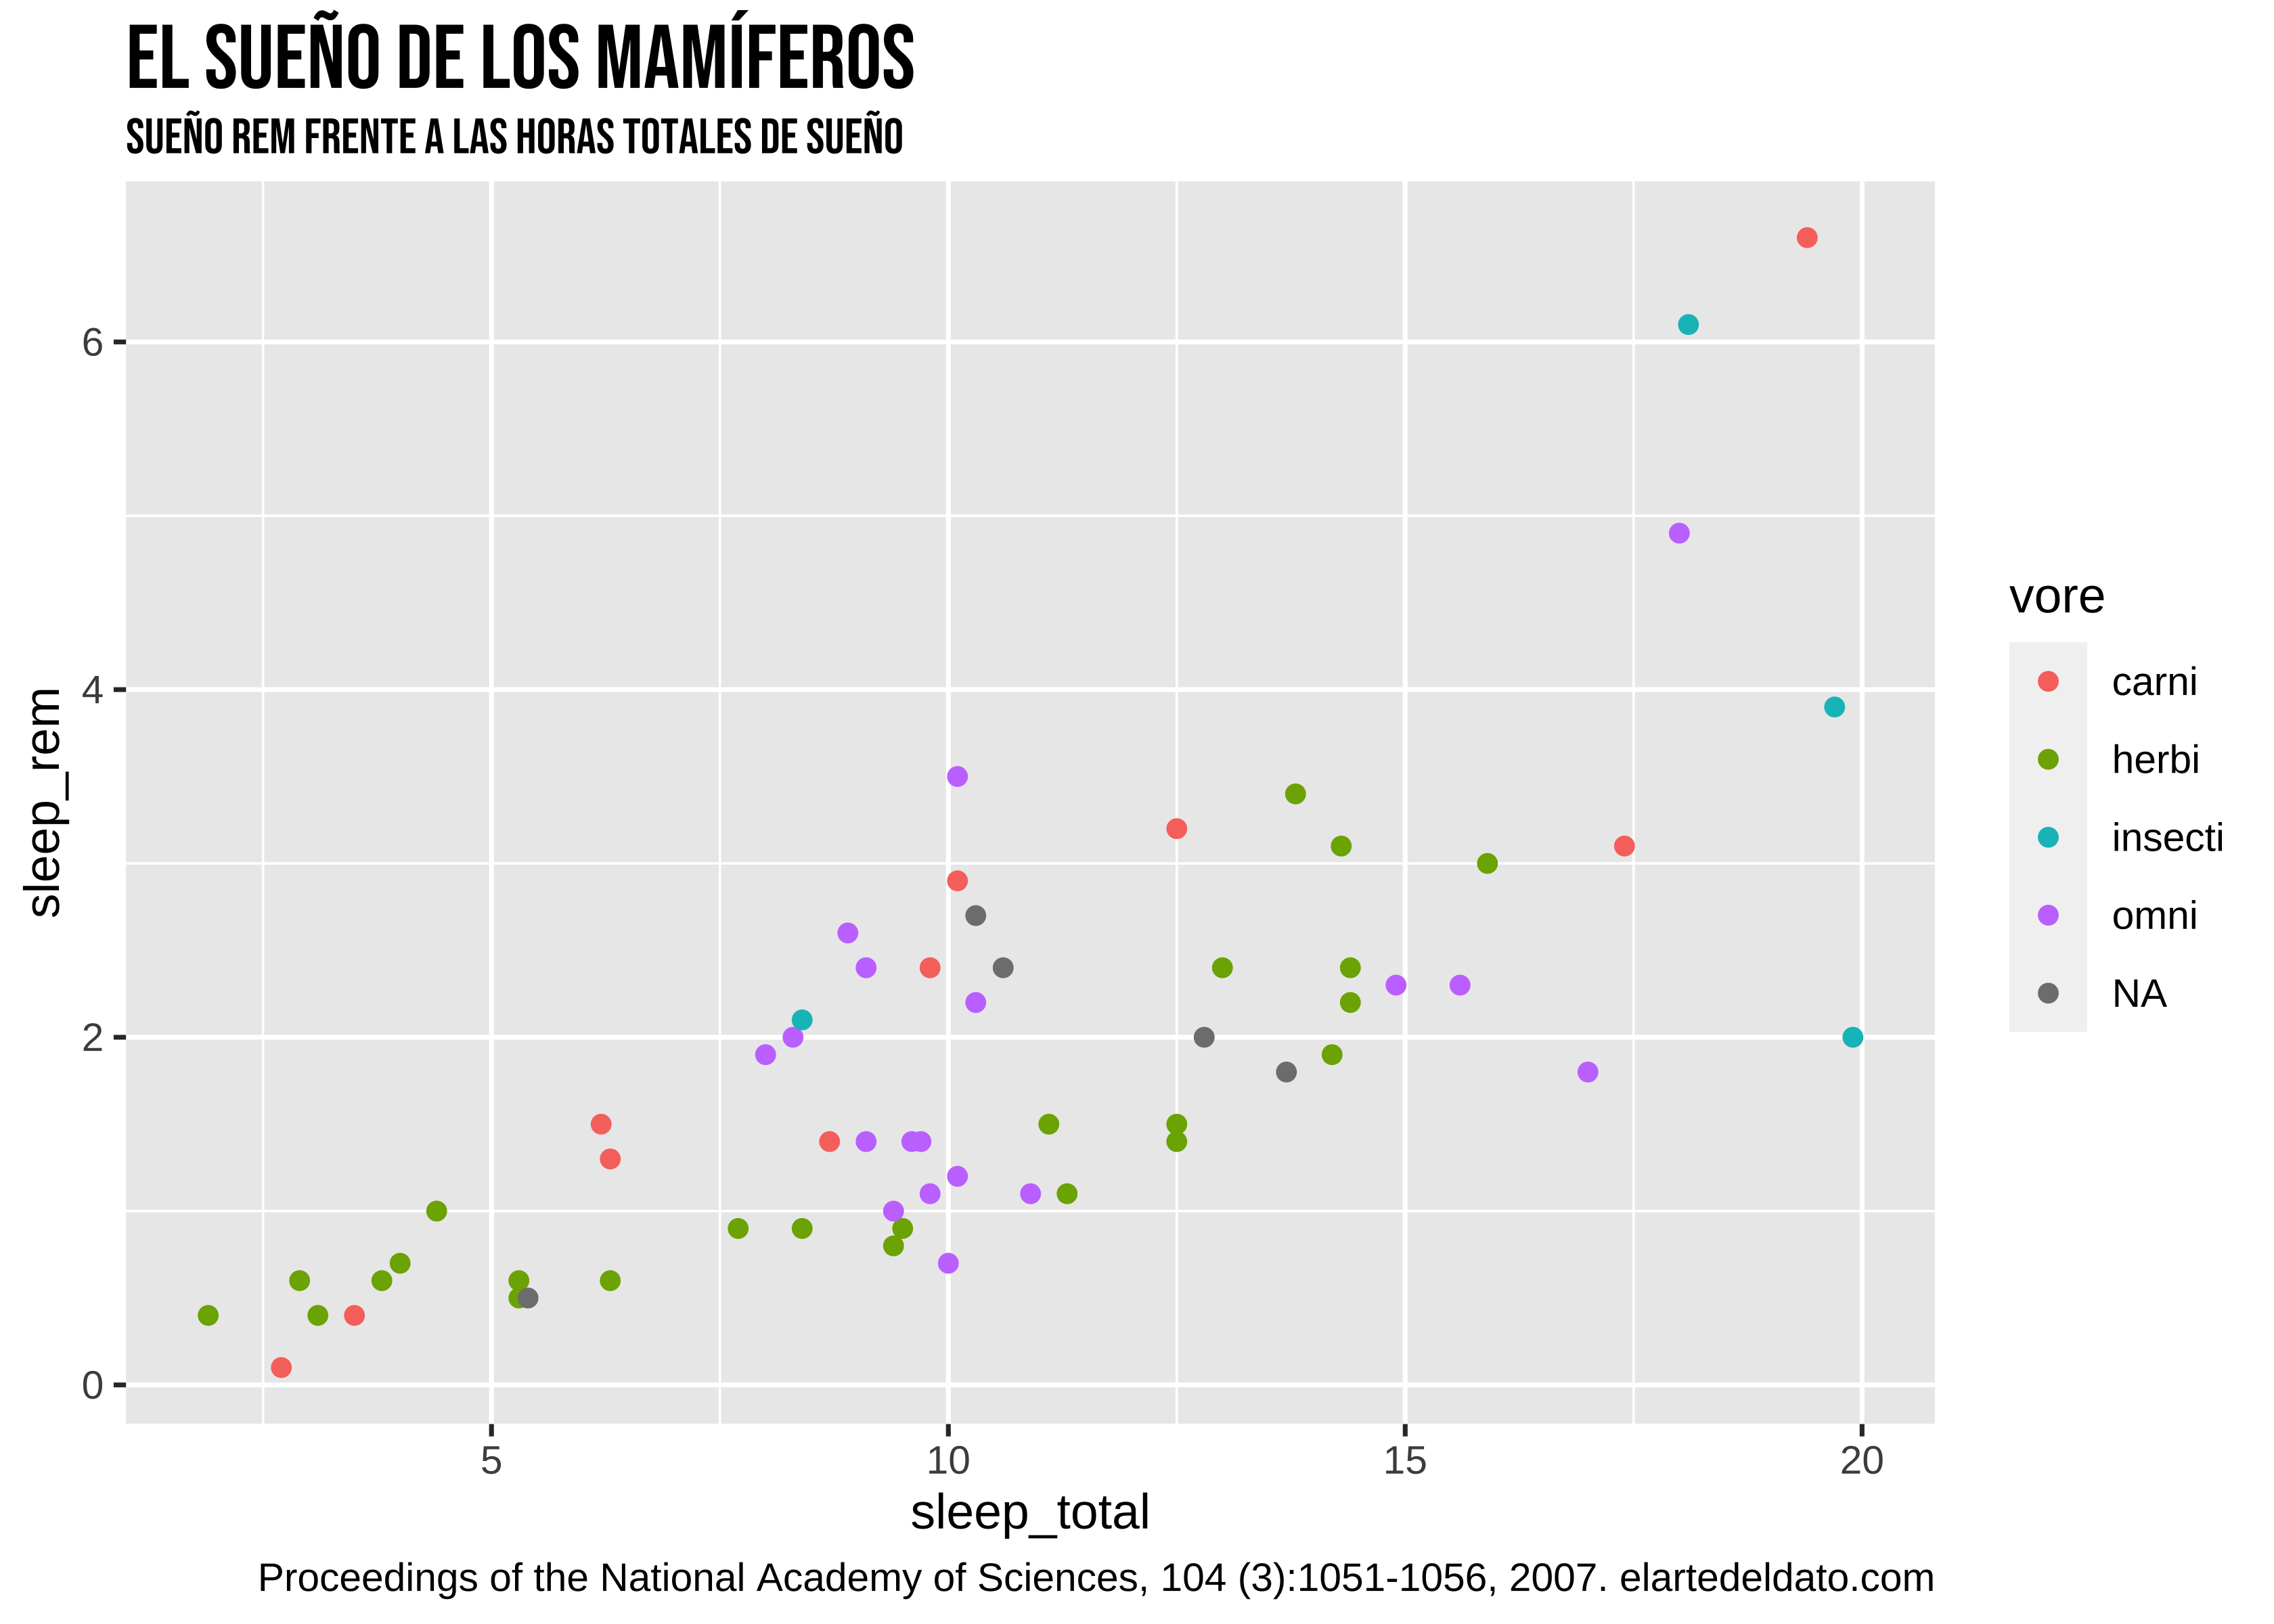
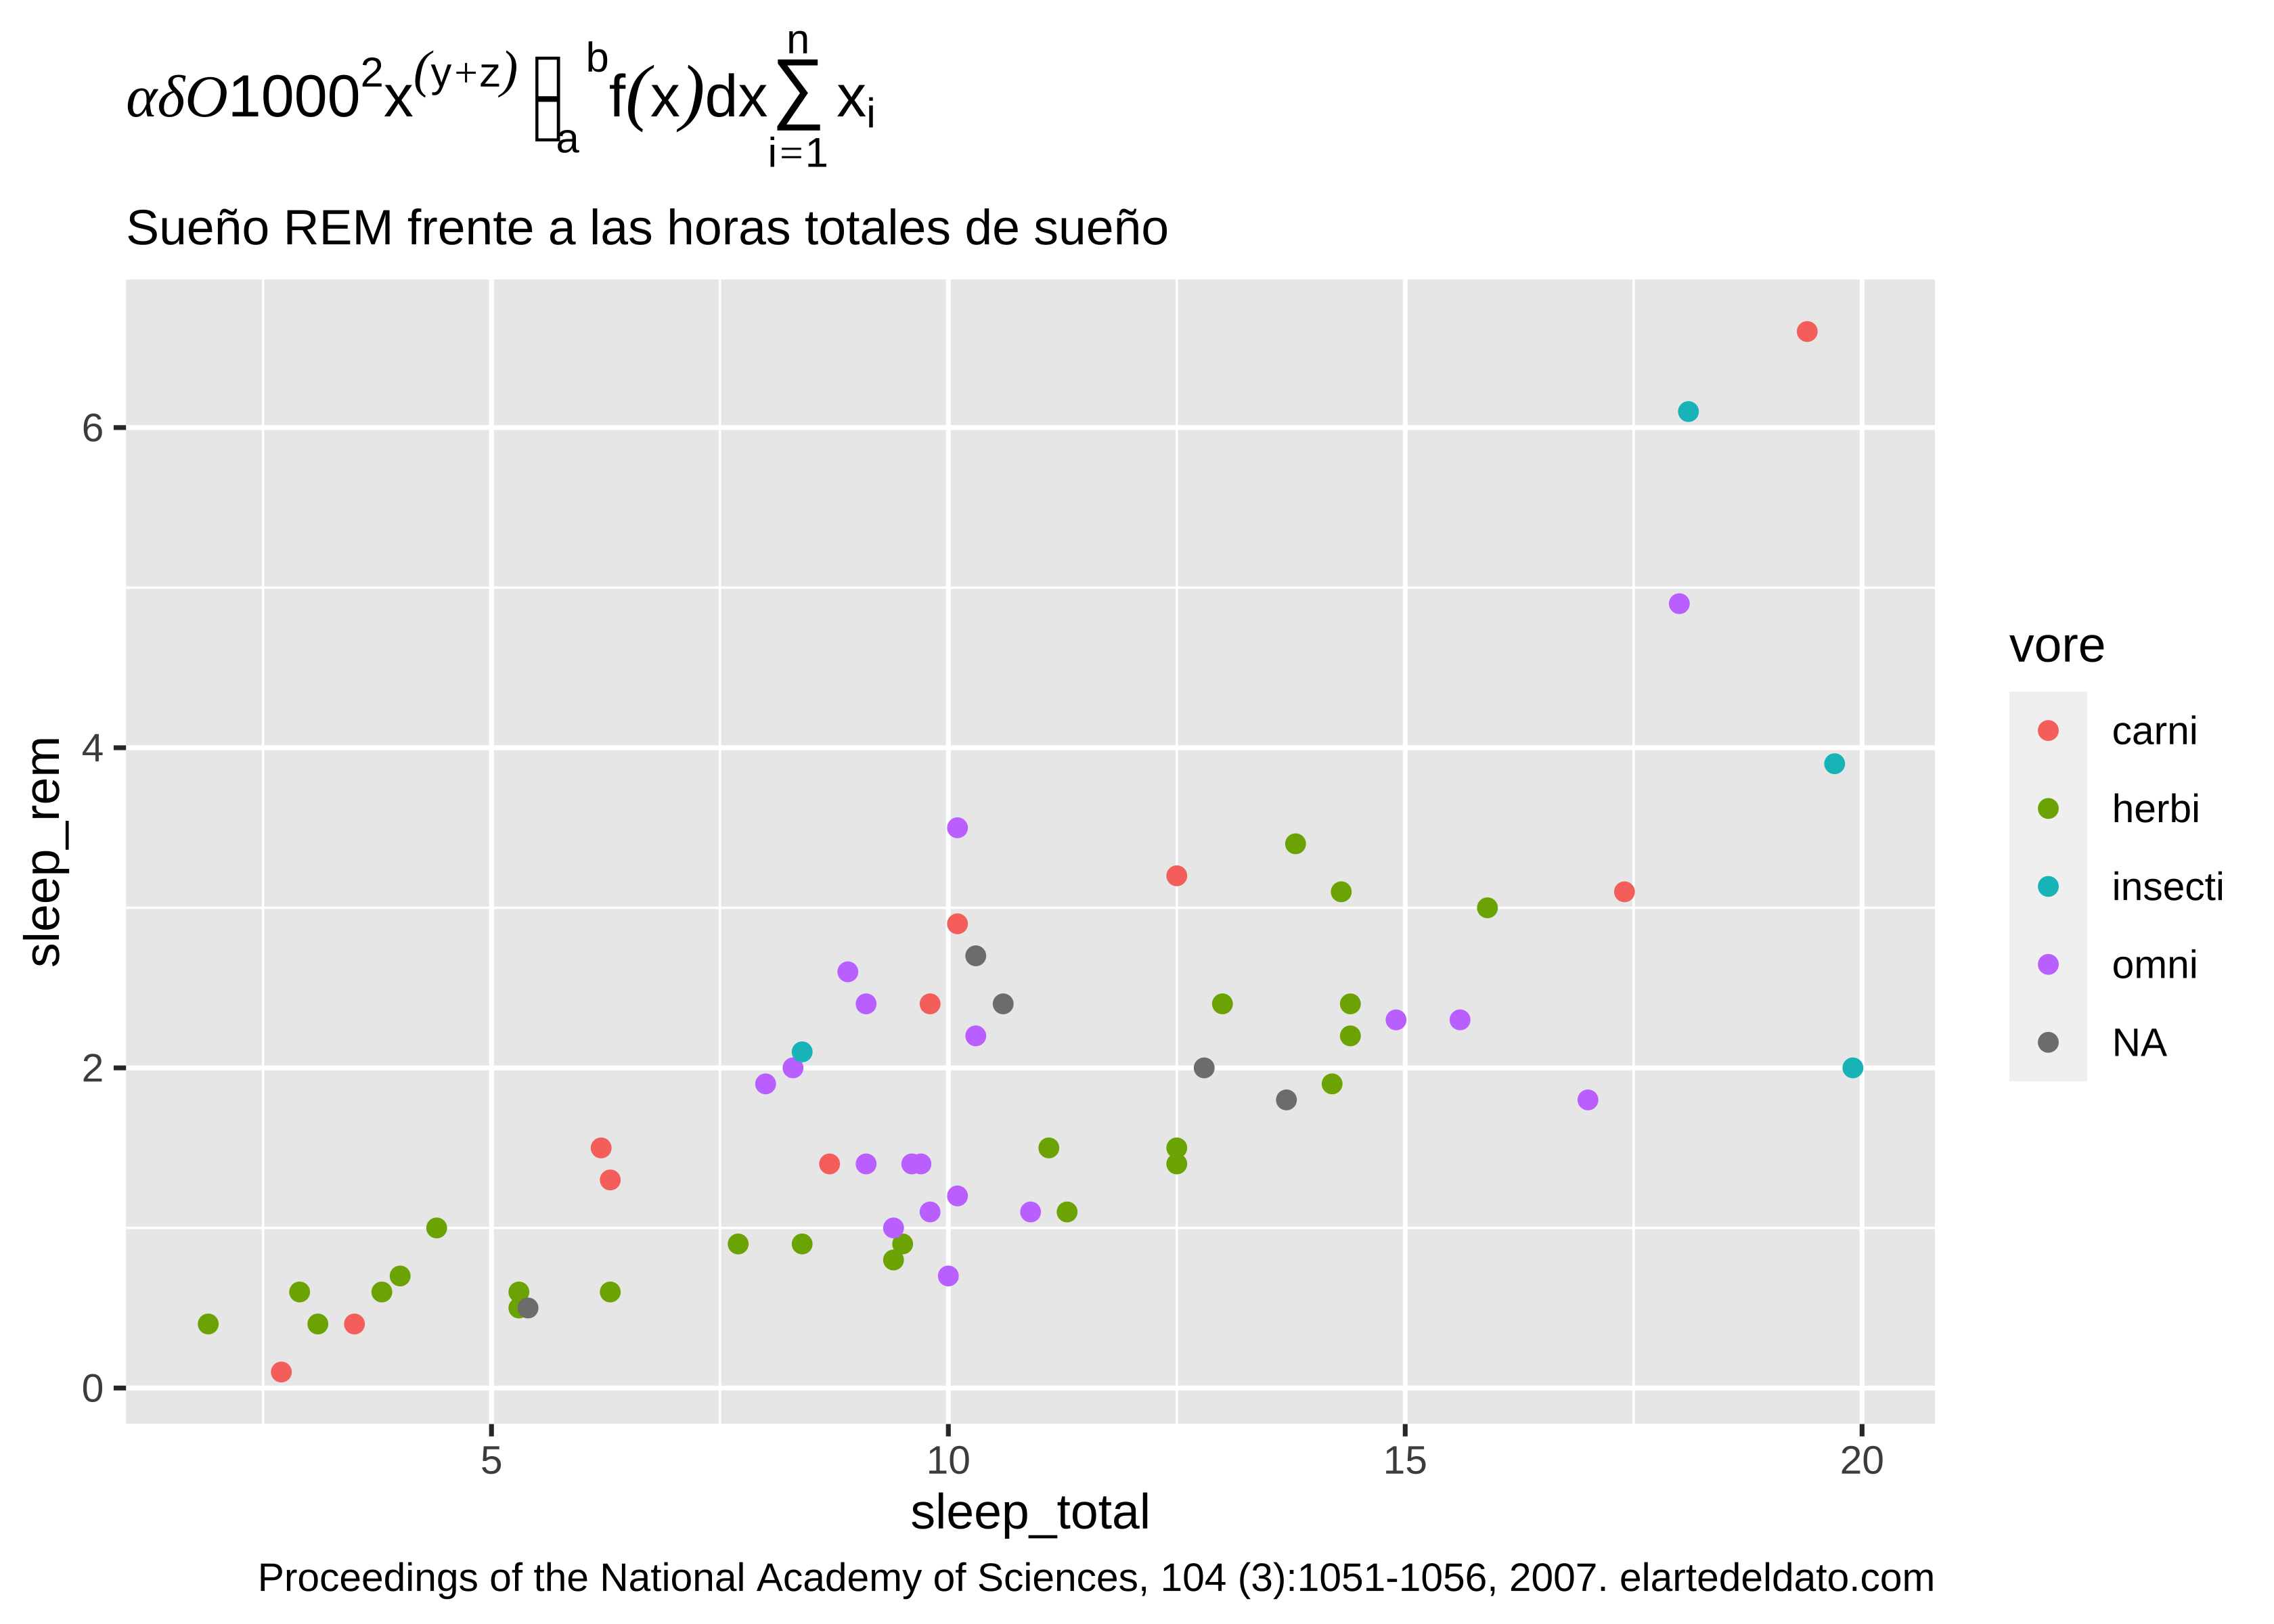
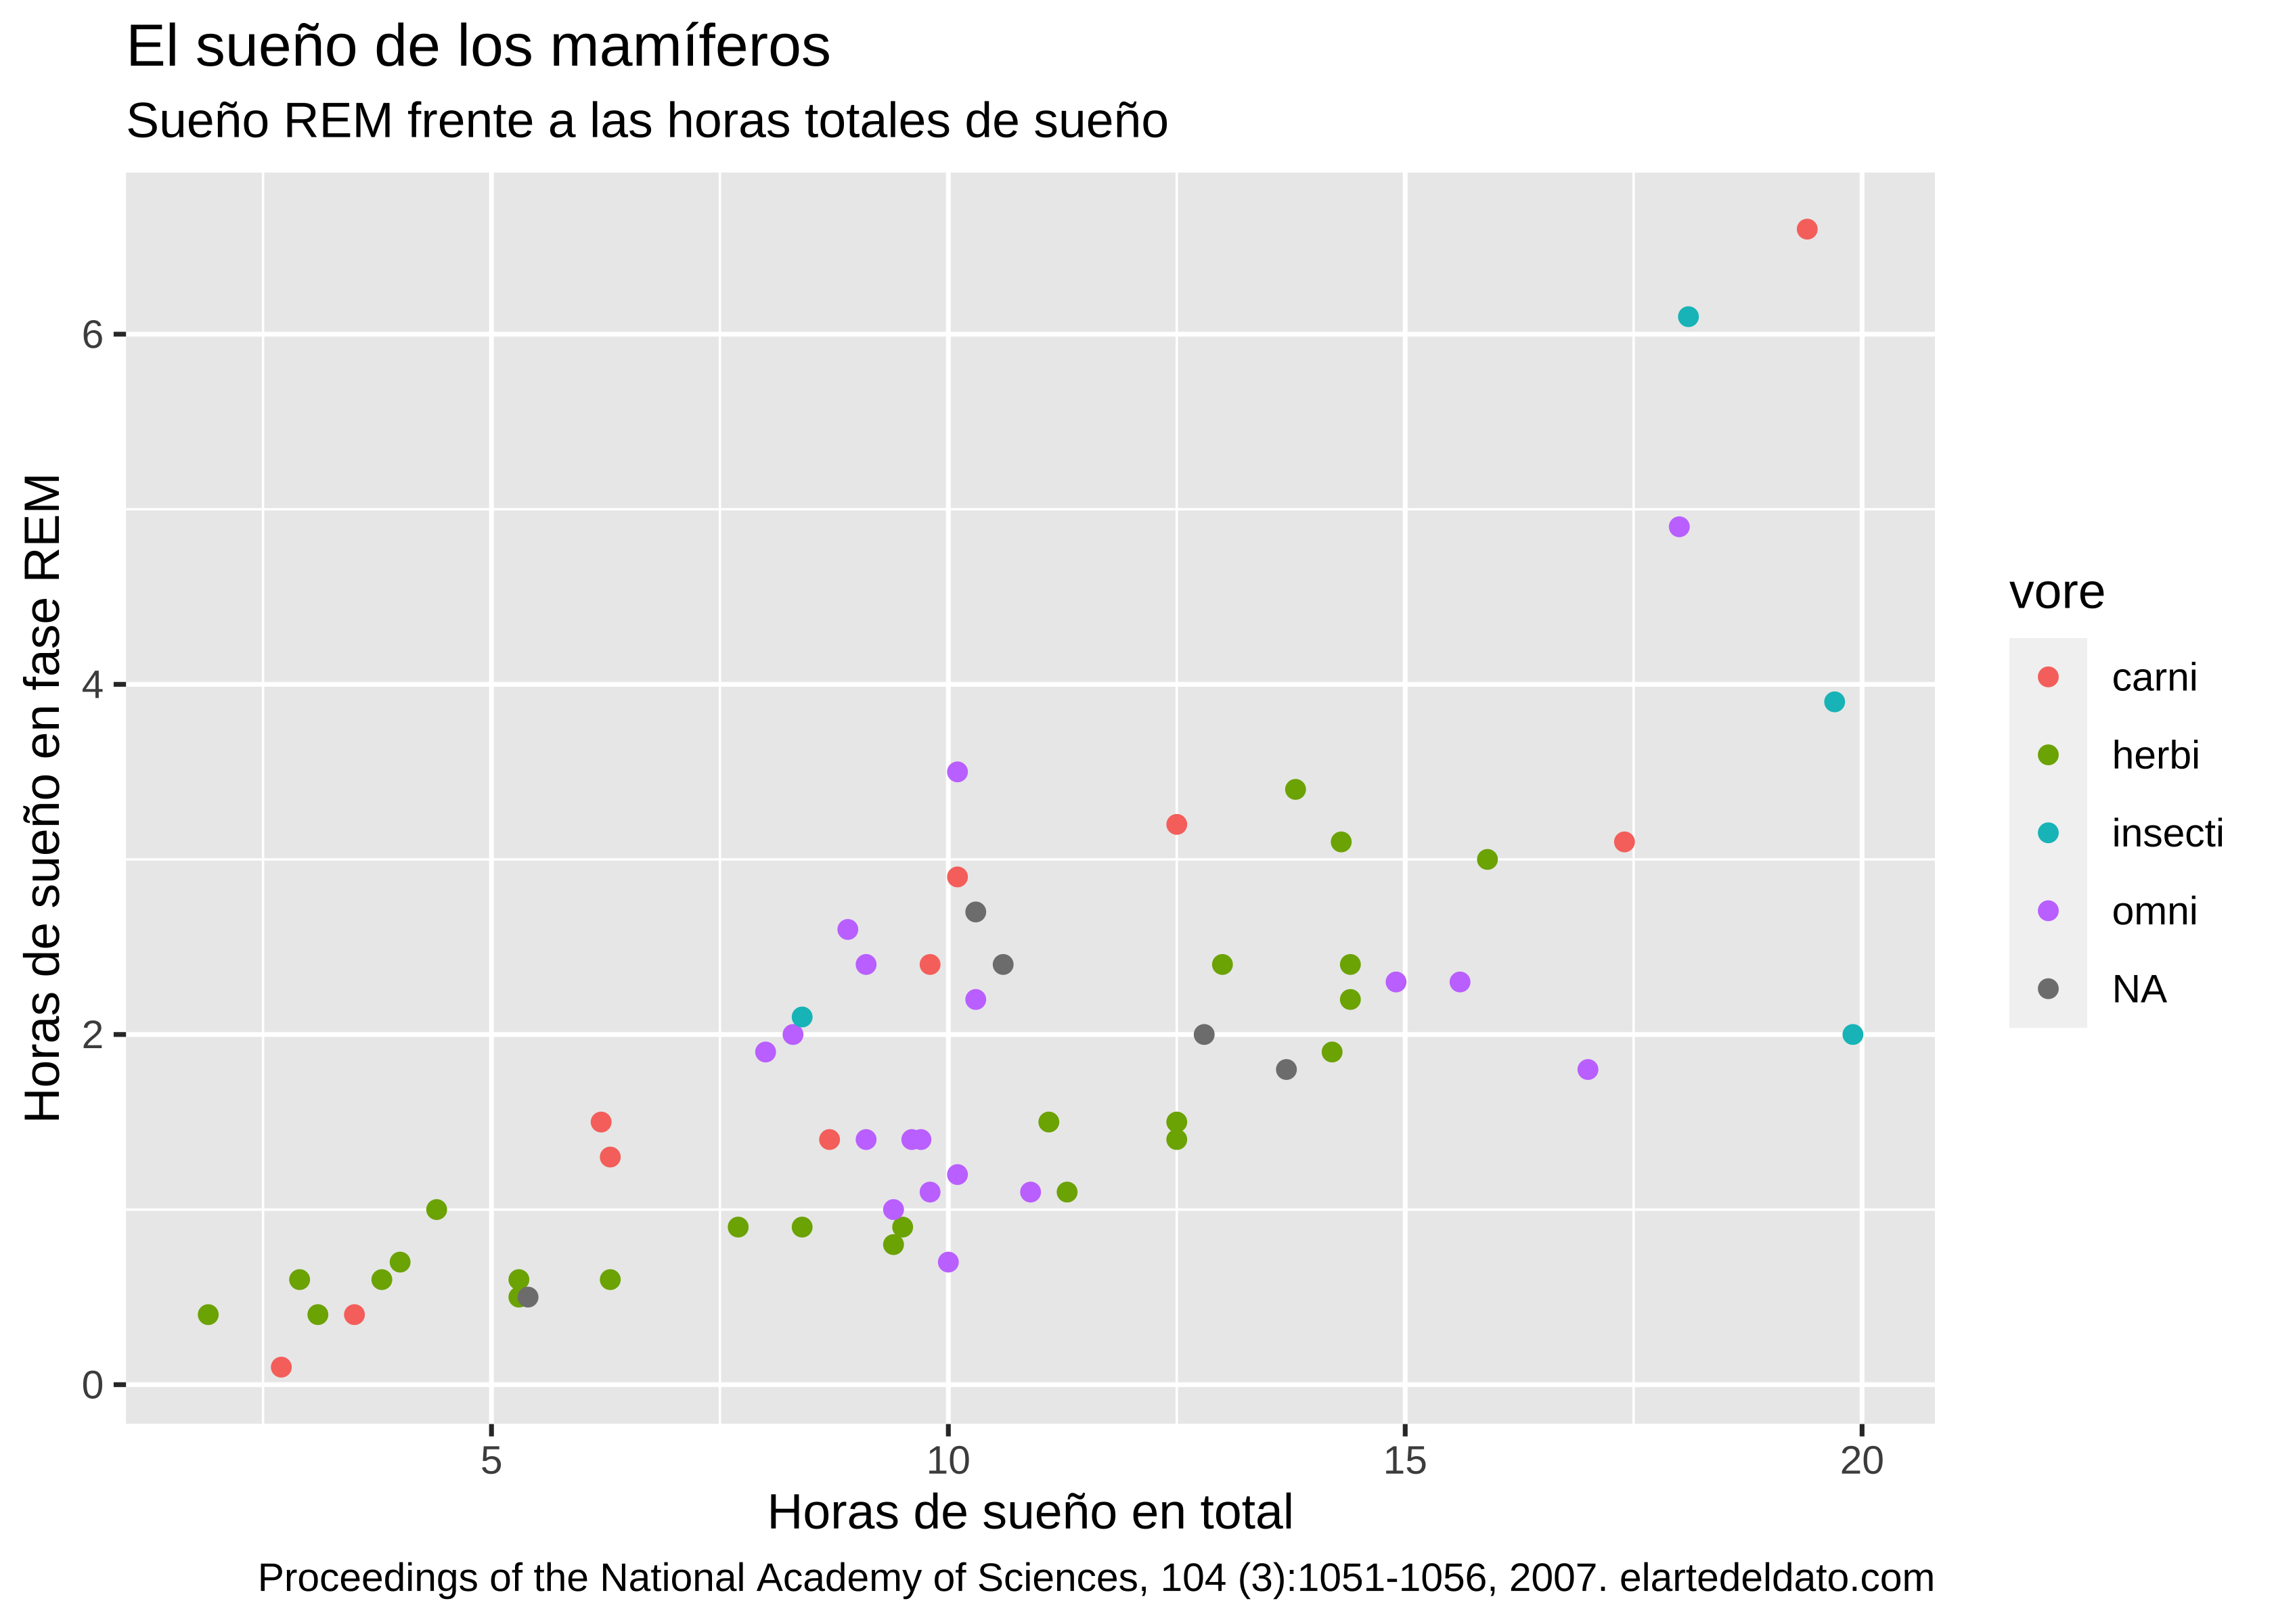
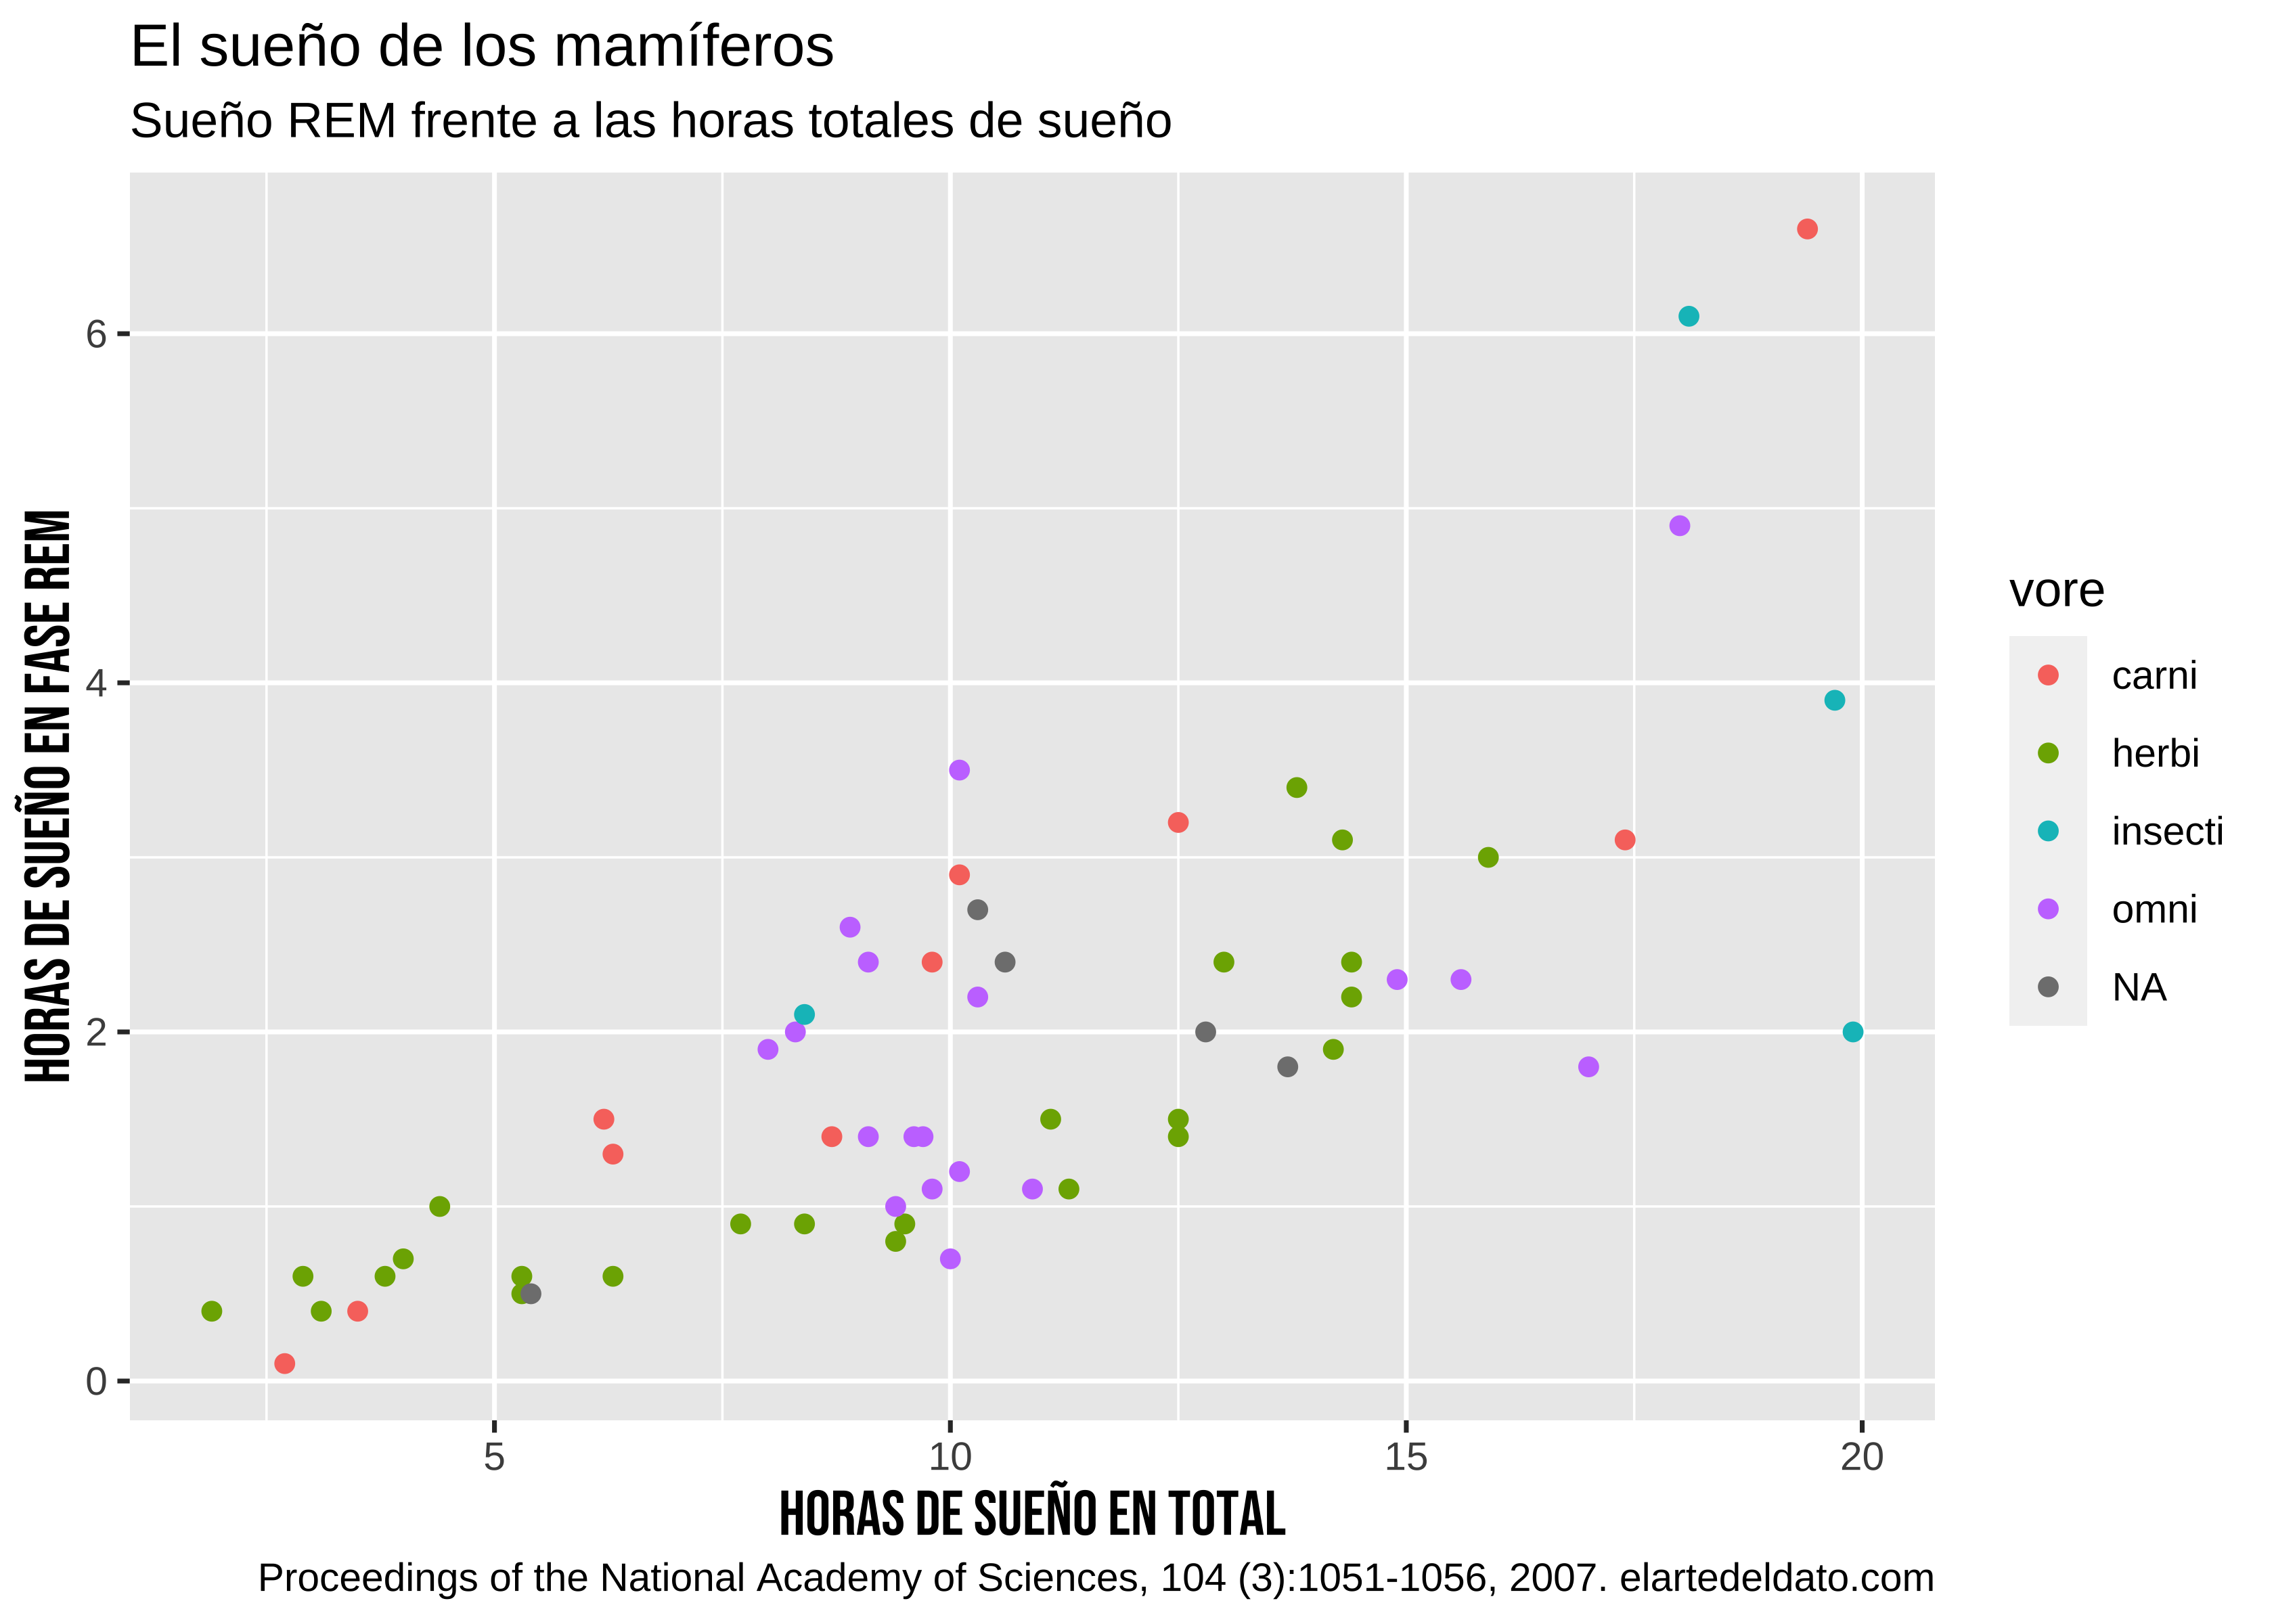
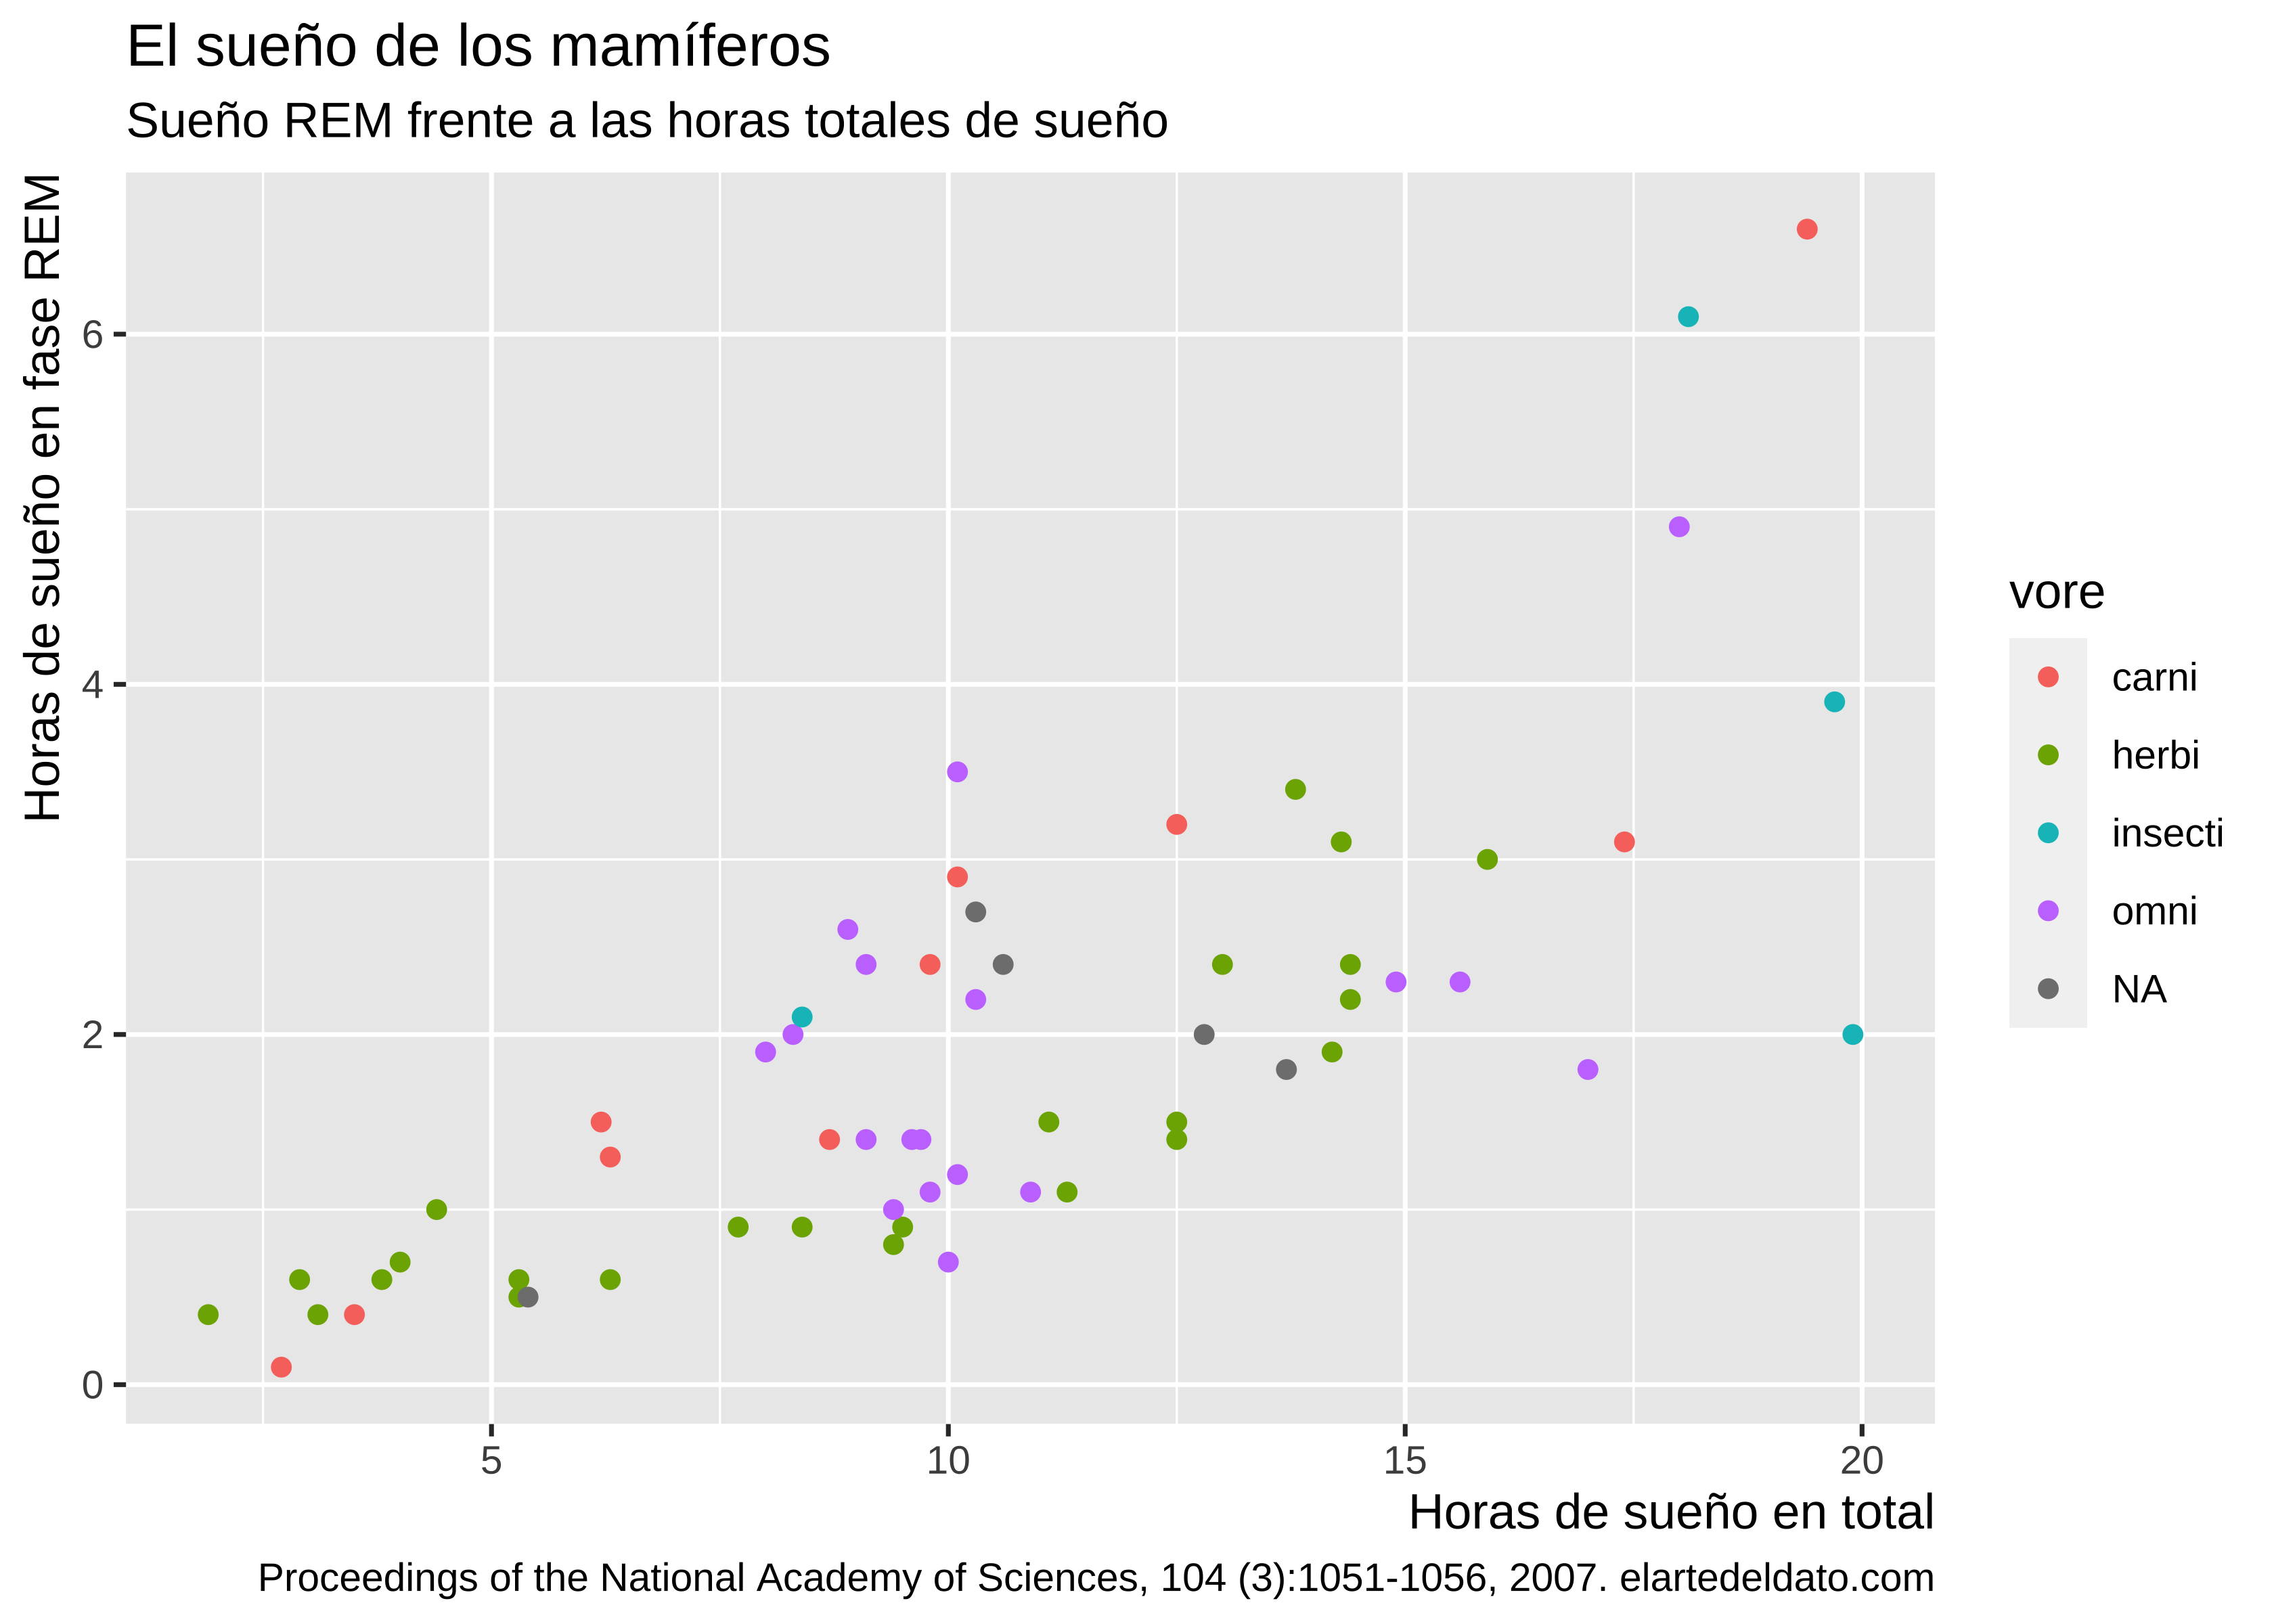
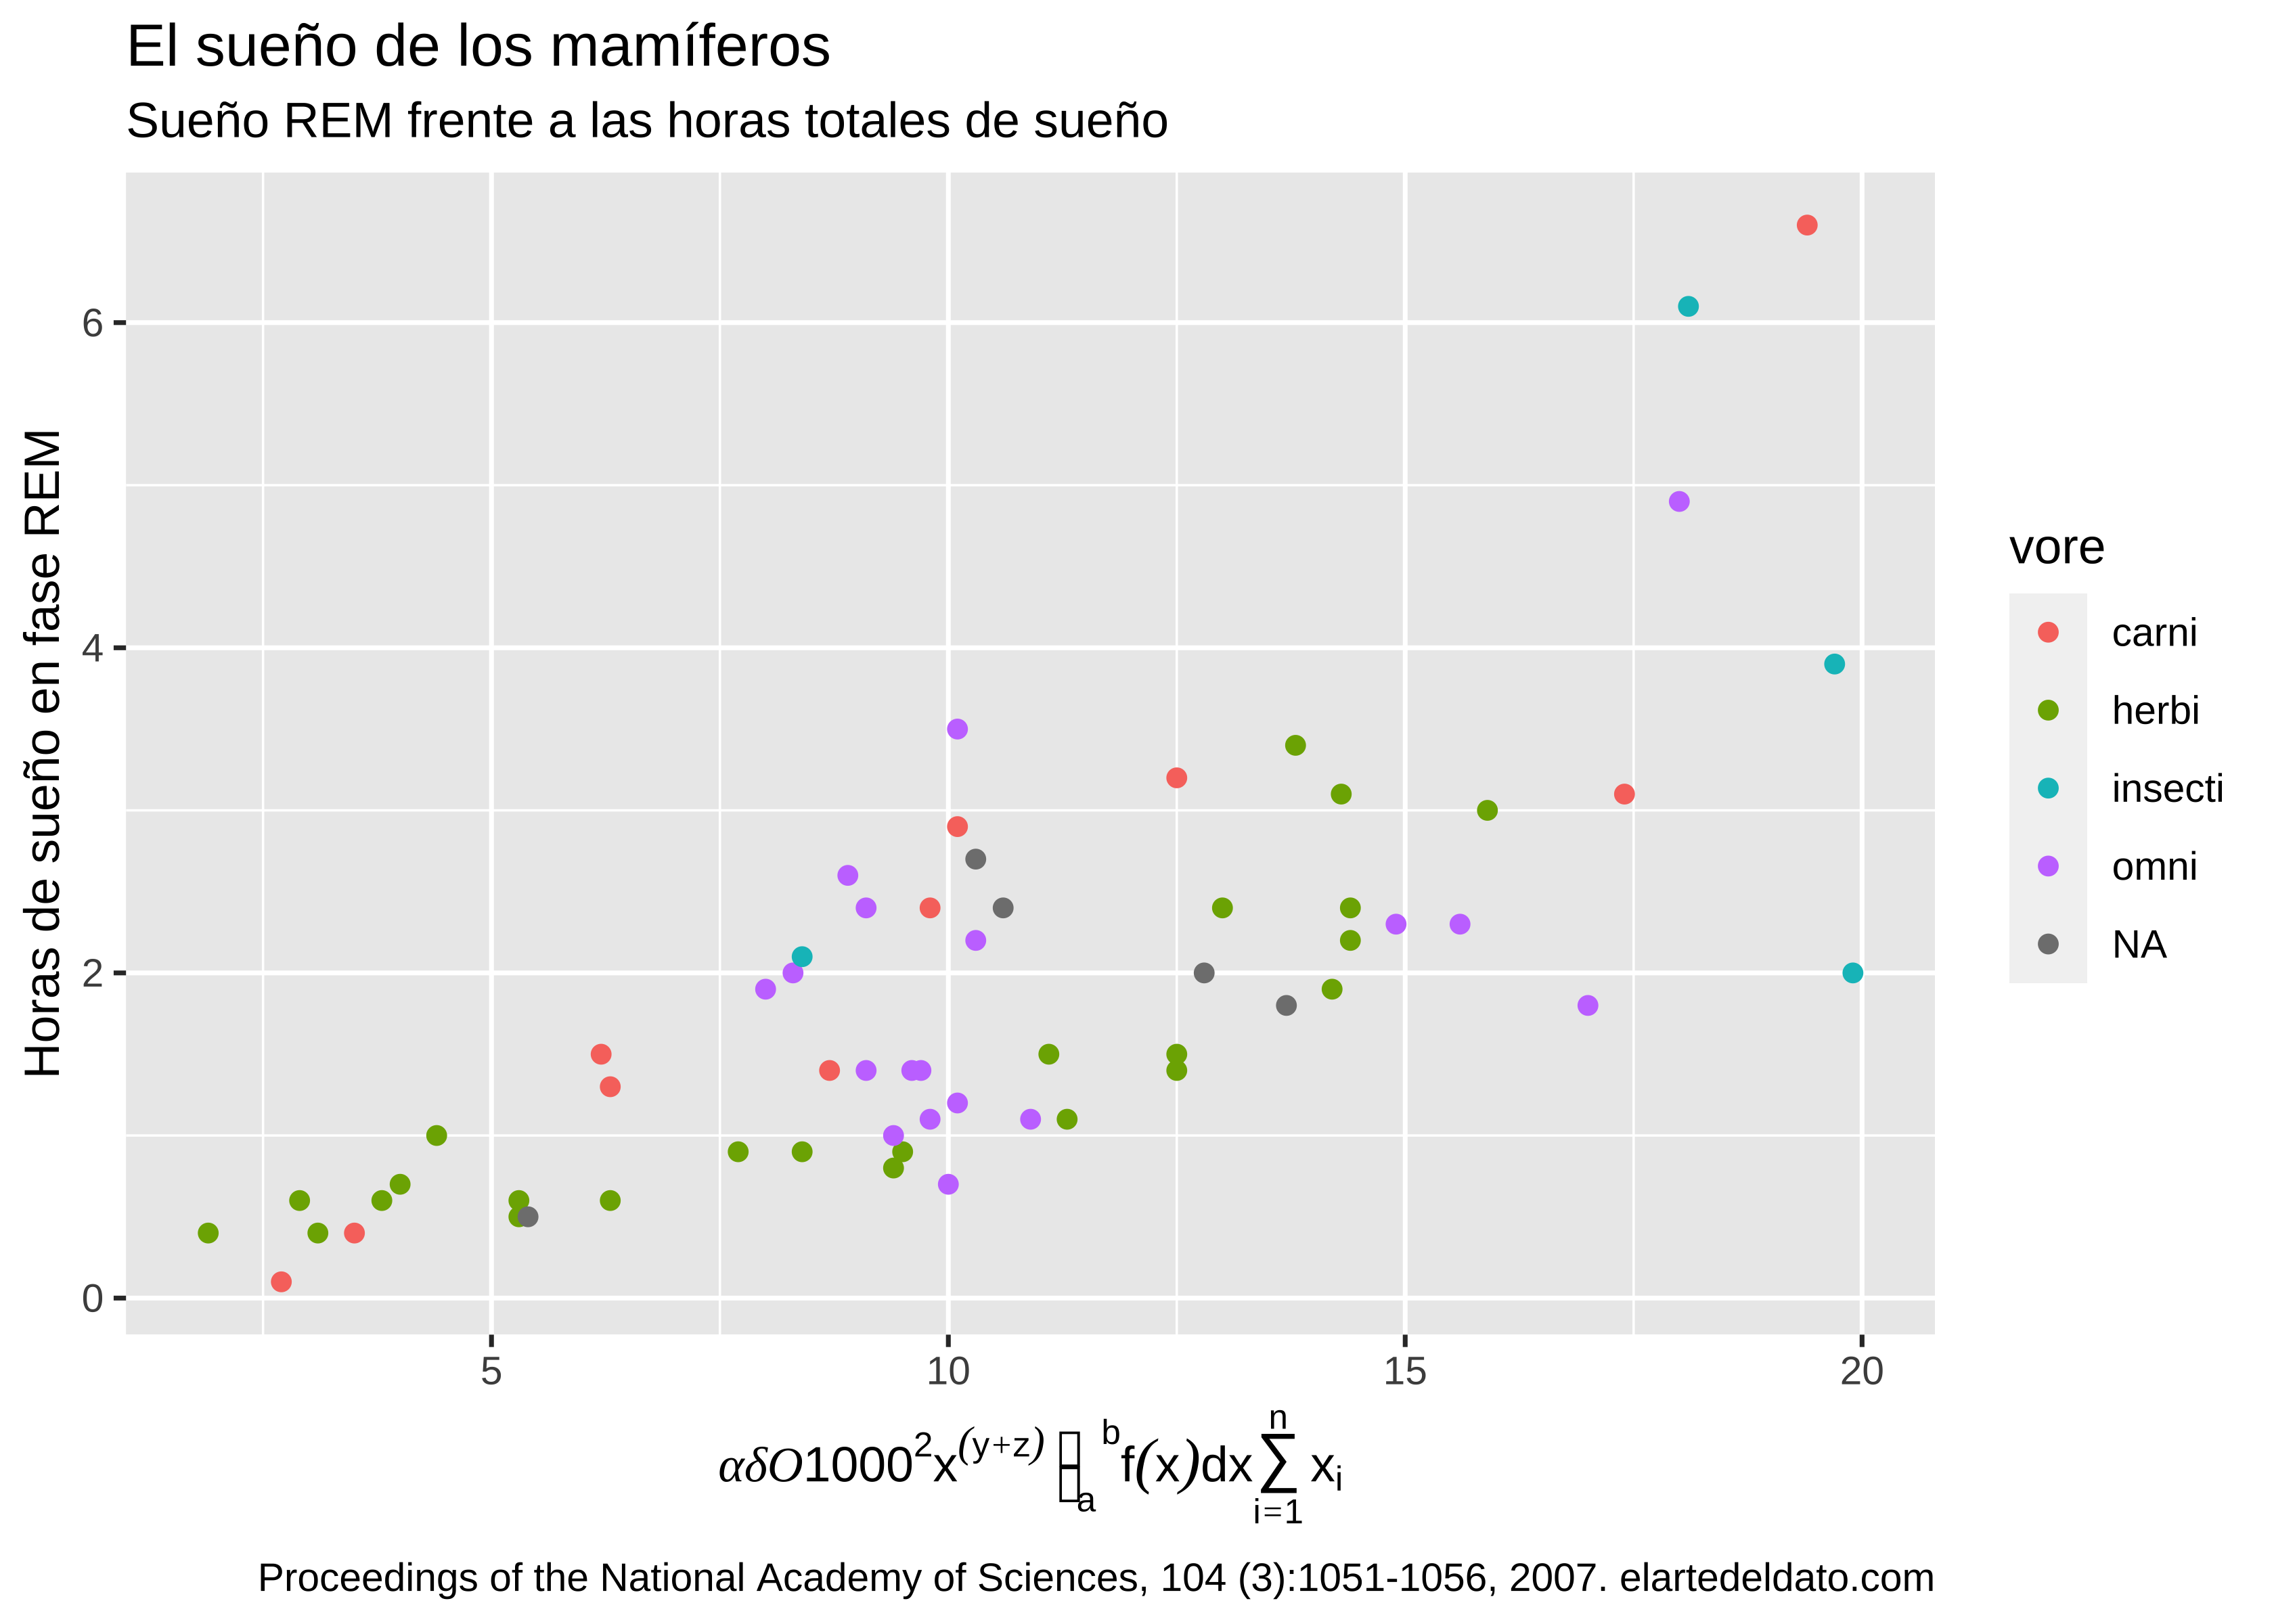
ggplot(msleep, aes(x = sleep_total, y = sleep_rem, color = vore)) +
geom_point() +
labs(
title = "El sueño de los mamíferos",
subtitle = "Sueño REM frente a las horas totales de sueño",
caption = "Proceedings of the National Academy of Sciences, 104 (3):1051-1056, 2007. elartedeldato.com"
)